

Top
Updated
24 Jul 2026Form Number
LP2368PDF size
16 pages, 1.1 MBSubscribed to LP2368.
Thank you for your feedback.
Table of Contents
Abstract
This whitepaper analyzes the shifting economic landscape of Generative AI infrastructure in 2026, positing that the industry’s transition from experimental prototyping to sustained, high-throughput inference has fundamentally altered the Total Cost of Ownership (TCO) calculus in favor of on-premises solutions.
Through a rigorous financial comparison of Lenovo ThinkSystem configurations against equivalent hyperscale cloud instances, the report demonstrates that on-premises infrastructure achieves a breakeven point in under four months for high-utilization workloads. By introducing the "Token Economics" framework, we further quantify the efficiency gap, revealing that owning the infrastructure yields up to an 17x cost advantage per million tokens compared to Model-as-a-Service APIs, offering a strategic roadmap for enterprises seeking to maximize the return on their AI investments over a five-year lifecycle.
This report is aimed at CIOs, CTOs, and AI Infrastructure Architects responsible for strategic hardware procurement and long-term financial planning. It assumes readers possess a foundational understanding of the Generative AI lifecycle—specifically the distinction between model training and inference—as well as familiarity with data center economics (CapEx vs. OpEx models) and the current ecosystem of accelerated computing hardware, including NVIDIA’s Hopper and Blackwell GPU architectures.
Change History
Changes in the July 24, 2026 update:
- Updated financial calculations to reflect latest pricing for on-premise and cloud implementations
- Added new models in the Token Economics section
- Added Onetera as a customer reference story - Real-World Validation: Onetera and the Lenovo On-Premises AI Platform
Executive Summary
As the artificial intelligence landscape transitions from the experimental fervor of 2023–2024 into the industrial-scale deployment phase of 2026, the economic models governing AI infrastructure are undergoing a radical realignment. The initial wave of Generative AI adoption was characterized by rapid prototyping on readily available cloud infrastructure, prioritizing speed of access over cost efficiency. However, the maturation of Large Language Models (LLMs), epitomized by the release of massive models exceeding 1 trillion parameters and the agentic workflows they enable, has introduced a new paradigm of sustained, high-throughput inference that challenges the financial viability of public cloud "rent-seeking" models.
This 2026 update to the 2025 Generative AI TCO paper rigorously re-evaluates the financial and technical trade-offs between on-premises infrastructure and cloud services. We incorporate the latest advancements in accelerated computing, specifically the NVIDIA Blackwell architecture (B200, B300, RTX PRO 6000), the widespread enterprise adoption of the H200 Tensor Core GPU, and the emergence of cost-efficient inference accelerators like the L40S. Furthermore, this report introduces "Token Economics", a granular, metric-driven framework analyzing the amortized cost-per-million-tokens—to provide a direct, apples-to-apples comparison between owning infrastructure and consuming intelligence via APIs.
Our analysis, based on a 5-year enterprise hardware lifecycle, identifies three critical market inflections in 2026:
- The Blackwell Efficiency Singularity: The architectural leap from Hopper to Blackwell improves inference throughput significantly, fundamentally altering TCO calculations by compressing the physical footprint required for massive models.
- Accelerated Breakeven Velocity: For sustained inference workloads, on-premises infrastructure now reaches a breakeven point against hyperscale cloud providers in as little as 6 months, a significant compression from the 12–18 month cycles observed in previous generations.
- The Rise of Efficient Inference: For the "workhorse" models in the 7B to 120B parameter range, the Lenovo ThinkSystem SR650i V4 (RTX PRO 6000) has emerged as a TCO champion, often outperforming Hopper-class cloud instances in price-performance for batch inference tasks.
The Generative AI Infrastructure Landscape in 2026
The operational reality of Generative AI has bifurcated into two distinct domains: the "Training Factory," characterized by massive, burst-oriented compute loads, and the "Inference Engine," characterized by persistent, latency-sensitive utility requirements. While the cloud remains a potent tool for the former, the latter drives the overwhelming majority of long-term enterprise costs.
From Hopper to Blackwell: The Hardware Evolution
The hardware landscape of 2026 is defined by the migration from NVIDIA’s Hopper architecture to the Blackwell architecture. This is not merely a linear performance increase; it is a structural change in how AI compute is delivered, heavily influencing Total Cost of Ownership.
- NVIDIA H100 & H200: The H100 established the baseline for GenAI. The H200 refined this with HBM3e memory, delivering 141GB of capacity and 4.8 TB/s of bandwidth. This expansion was critical for alleviating the memory-bound bottlenecks of LLM inference, allowing larger models to reside on fewer GPUs.
- NVIDIA Blackwell Series (B200 & B300 Ultra): Built for high-throughput and massive scale, the dual-die B200 packs 208 billion transistors, 192GB of HBM3e memory, and FP4 precision support via the 2nd Gen Transformer Engine. For the "trillion-parameter era," the B300 Ultra expands capacity to 288GB HBM3e per GPU (1.5x the B200), enabling massive-context inference and multi-billion parameter model execution on a single node.
- NVIDIA RTX PRO 6000 (Blackwell Server Edition): Engineered for high-density enterprise nodes, this architecture delivers 96GB of high-speed VRAM per card. By providing massive combined VRAM pools (up to 768GB in an 8-GPU node) at a lower capital footprint than flagship hyperscale chips, it serves as an ideal foundation for privacy-focused, agentic enterprise workloads.
- NVIDIA L40S: A universal data center GPU based on the Ada Lovelace architecture. With 48GB of GDDR6 memory, it avoids the supply constraints of H-series GPUs and offers a highly cost-effective alternative for fine-tuning and inference of small-to-medium models.
The Shift to "Token Economics"
In 2026, the primary metric for AI success has evolved from "FLOPS" (Floating Point Operations Per Second) to "Tokens Per Second per Dollar" (TPS/$). Organizations are moving away from measuring server uptime and towards measuring the cost efficiency of token generation. This shift necessitates a comparison not just of server hardware costs, but of the amortized cost of generating 1 million tokens on-premise versus the "retail price" of 1 million tokens from a cloud API.
The Lenovo Infrastructure Portfolio
To facilitate direct comparison, we analyze specific Lenovo ThinkSystem platforms engineered for these accelerators:
- ThinkSystem SR675 V3: A versatile 3U platform supporting mixed configurations of H100, H200, and L40S GPUs.
- ThinkSystem SR680a V3: An 8U air-cooled server optimized for maximum GPU density, supporting 8x H200 or B200 SXM GPUs.
- ThinkSystem SR680a V4: The flagship platform for 2026, designed for the B300 and Intel Xeon 6 processors. It features N+N power redundancy and advanced thermal headroom.
- ThinkSystem SR650a V4: A dense, cost-optimized 2U server supporting up to 4x L40S GPUs, targeting efficient inference at the edge or in space-constrained data centers.
- ThinkSystem SR650i V4: A specialized PCIe platform configured with NVIDIA RTX PRO accelerators, balancing workplace-ready physical footprints with deep-learning deployment needs.
- ThinkSystem SR650 V4: A high-performance, mainstream 2U server utilizing Intel Xeon 6 processors, engineered to optimize high-density compute tasks and CPU-driven corporate AI workloads without mandatory standalone GPU dependencies.
Large Language Models - The New Workload
To accurately calculate TCO, one must first understand the physical resource consumption of the workload itself. Large Language Models (LLMs) impose unique constraints on infrastructure that differ significantly from traditional enterprise applications. For more information, you can refer to the Lenovo LLM Sizing Guide.
The Memory Wall
For inference, LLMs are predominantly memory-bound rather than compute-bound. The entire model architecture must be loaded into GPU memory (VRAM), and for every token generated, the model weights must be moved from memory to the compute units.
- Model Sizing Rule of Thumb: A model generally requires approximately 2 bytes per parameter in FP16/BF16 precision.
- 70B Parameter Model: Requires ~140GB VRAM (FP16), barely fitting on a single H200 or necessitating multi-GPU tensor parallelism on smaller cards.
- 400B+ Parameter Model: Requires ~800GB+ VRAM (FP16), mandating an 8-GPU cluster (H200/B200) just to load the model.
KV Cache Overhead
In addition to static weights, the Key-Value (KV) cache grows linearly with context length and batch size. For modern "long-context" models supporting 1M tokens, the KV cache can consume more memory than the model itself.
Quantization as a Cost Lever
Quantization reduces the precision of model weights (e.g., from 16-bit to 8-bit or 4-bit), significantly lowering memory requirements and increasing throughput without substantial accuracy loss.
Financial Framework and Metrics
This report utilizes a rigorous financial framework to compare disparate consumption models—CapEx-heavy on-premises vs. OpEx-heavy cloud.
Core TCO Metrics
- CapEx (Capital Expenditure): The upfront cost of purchasing servers, GPUs, networking (InfiniBand/Ethernet), and storage. For this analysis, we amortize CapEx over a standard 5-year enterprise hardware lifecycle. While, in real conditions a system will have a recovery value, for our comparison we donate the system away with $0 recovery.
- On-Premises Operational Costs: For accurate TCO, we assume the following operational costs for an on-premises deployment:
- Annual Maintenance: 12% of system cost per year.
- Electricity: $0.12 per kWh (US Commercial Average).
- Cooling Costs: $0.18 per kWh for air cooled, $0.09 per kWh for liquid cooled (on average).
- Colocation: ~$1,500/month per rack for high-density power (Configs A-D). ~$600/month per rack for standard-density (Config E)
- Cloud: Hourly instance rates only. To demonstrate that Lenovo infrastructure remains superior even under the most charitable cloud assumptions, we explicitly exclude storage costs, data egress fees, and support plans from the cloud calculation.
- TPS (Tokens Per Second): The measure of throughput; defined as the number of output tokens produced by the model per second. This is the primary metric for measuring the speed of a model on a system.
- Cost Per Million Tokens ($/1M): A normalized efficiency metric allowing direct comparison between buying hardware and buying API tokens.
Cloud Pricing Methodology
We compare Lenovo infrastructure against the three major hyperscalers (AWS, Azure, GCP). Prices are derived from listed rates for US regions where systems are available to rent (as of July 15, 2026).
Hardware and Instance Comparison (2026)
To perform a valid TCO analysis, we align Lenovo on-premises configurations with their nearest cloud equivalents.
Comparison Configurations
We compared configurations across different generations to provide a comprehensive overview. The table below lists the systems we compared.
System Pricing
Using our Internal Configurator tool, we have created configs comparable to the cloud counterparts. Provided below are the usual sale price to the customer (as of June 15, 2026, in USD):
- Config A (2xRTX PRO 6000): $68,010.96
- Config B (8xH200): $397,801.60
- Config C (8xB200): $550,475.10
- Config D (8xB300): $785,606.50
- Config E (4xL40S): $113,186.50
- Config F (Intel Xeon 6): $82,265.40
Cloud Instance Pricing (Hourly Rates)
All major cloud instances have the following systems available to rent on-demand or reserve an instance. We are using the publicly available pricing that was available from official sources at the time of writing.
Total Cost of Ownership (TCO) Analysis
In this section, we evaluate the financial performance of on-premise vs. cloud across three specific scenarios:
Case 1: Breakeven Point Analysis
Scenario: Comparing the breakeven point of purchasing Config B (8x H200) versus renting the equivalent Azure ND96isr H200 v5.
- Cloud Cost (Azure):
- On-Demand: $114.656/hr
- 1-Year Reserved: $73.39/hr
- 3-year Reserved: $50.33/hr
- 5-year Reserved: $46.56/hr
- On-Prem Cost (Lenovo Config B):
- CapEx: $397,801.6
- OpEx (Hourly): $9.80 ($5.45 amortized maintenance + $2.27 for power and cooling + $2.08 colocation)
Breakeven Calculation (vs. On-Demand):
397801.6 + 9.80x = 114.656x
104.856x = 397801.6
⇒ x ≈ 3793 hours
Result: ~5.2 months to break even.
Breakeven Calculation (vs. 1-Year Reserved):
397801.6 + 9.80x = 73.39x
63.59x = 397801.6
⇒ x ≈ 6250 hours
Result: ~8.5 months to break even. Even against a committed 1-year reserved instance, the Lenovo system pays for itself in three quarters!
The following figure showcases the comparison between on-prem system and the cloud pricing for on-demand as the breakeven. We also show how changing to a 1-year reserved instance affects the breakeven period.
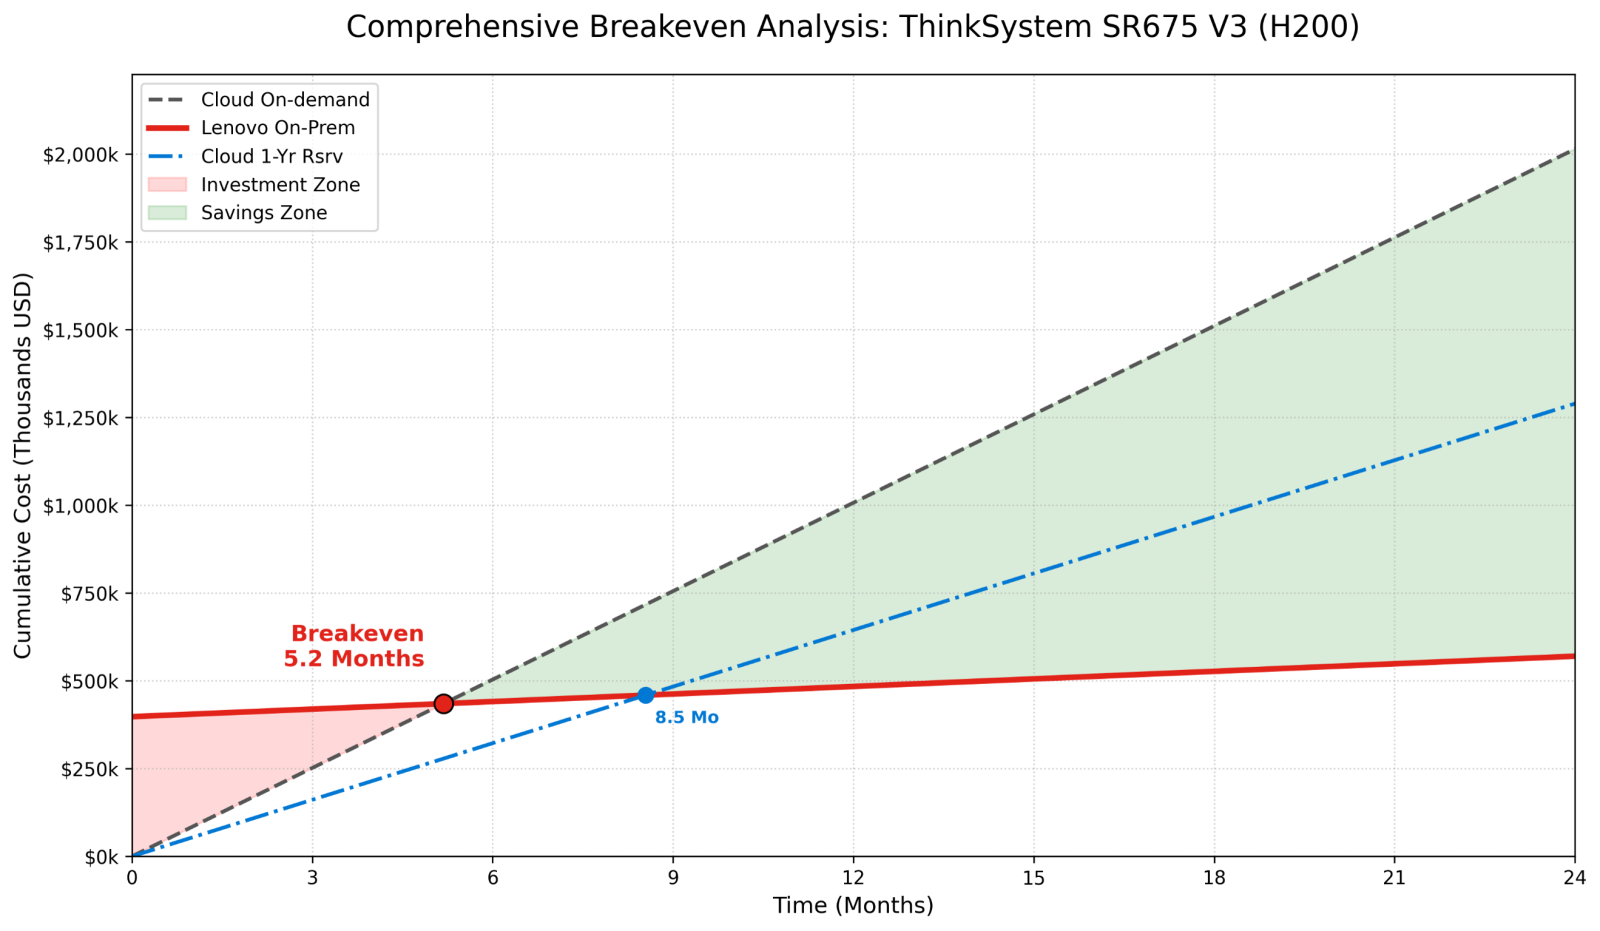
Figure 1: Breakeven Analysis for on-demand and 1-year reserved instance for 8x H200 on cloud vs on-prem
Breakeven Calculation (vs. 3-Year Reserved):
397801.6 + 9.80x = 50.33x
40.53x= 397801.6
⇒x ≈ 9,800 hours
Result: ~13.4 months to break even. Considering heavy discounts on cloud after committing for 3-years, Lenovo system pays for itself in just over a year.
Breakeven Calculation (vs. 5-Year Reserved):
397801.6 + 9.80x = 46.56x36.76x = 397801.6
⇒ x ≈ 10,800 hours
Result: ~14.8 months to break even. So, you will be saving money for 45 months after the breakeven!
Similar to Figure 1, the figure below showcases the breakeven comparison but for 3-year reserved instance and showcases the tiny change when renting a 5-year reserved instance. Still, breakeven is achieved in under 15 months!
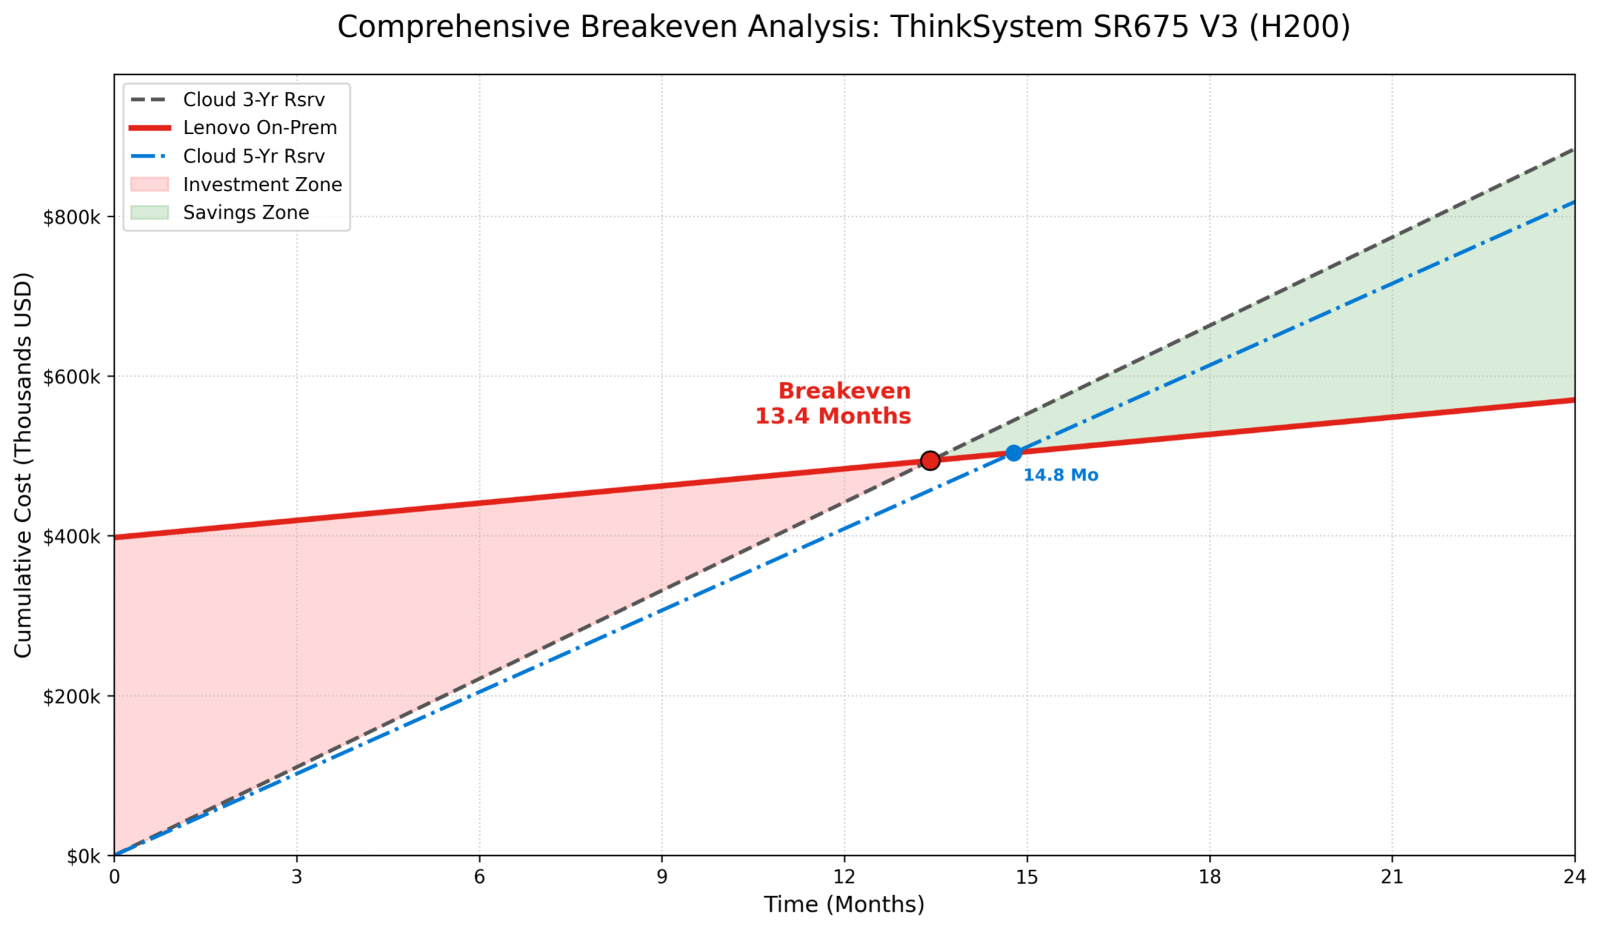
Figure 2: Breakeven Analysis for 3-year and 5-year reserved instance for 8x H200 on cloud vs on-prem
Case 2: Total Cost of System Over Time (5-Year Lifecycle)
Scenario: A 5-year comparison of the flagship Config D (8x B300) versus the AWS p6-b300.48xlarge.
- Cloud Cost (AWS p6-b300):
- Hourly Rate: $142.75
- Total 5-Year Cost (24/7): 142.75 × 24 × 365 × 5 = $6,252,450
- On-Prem Cost (Lenovo Config D):
- CapEx: $785606.5
- OpEx (Hourly) : ~$16.44 ($10.76 maintenance + $3.6 power and cooling + $2.08 colocation)
- Total 5-Year Cost: 785,606.5 + (16.44 x 43,800) = $1,505,678.5
Total Savings: $4,746,771.5 (76% Savings!) Over a 5-year lifecycle, owning the B300 infrastructure saves $4.75 million per server compared to the hourly cloud rate.
In the figure below, we can see the yearly (cumulative) savings by owning a Lenovo ThinkSystem compared to renting on cloud.
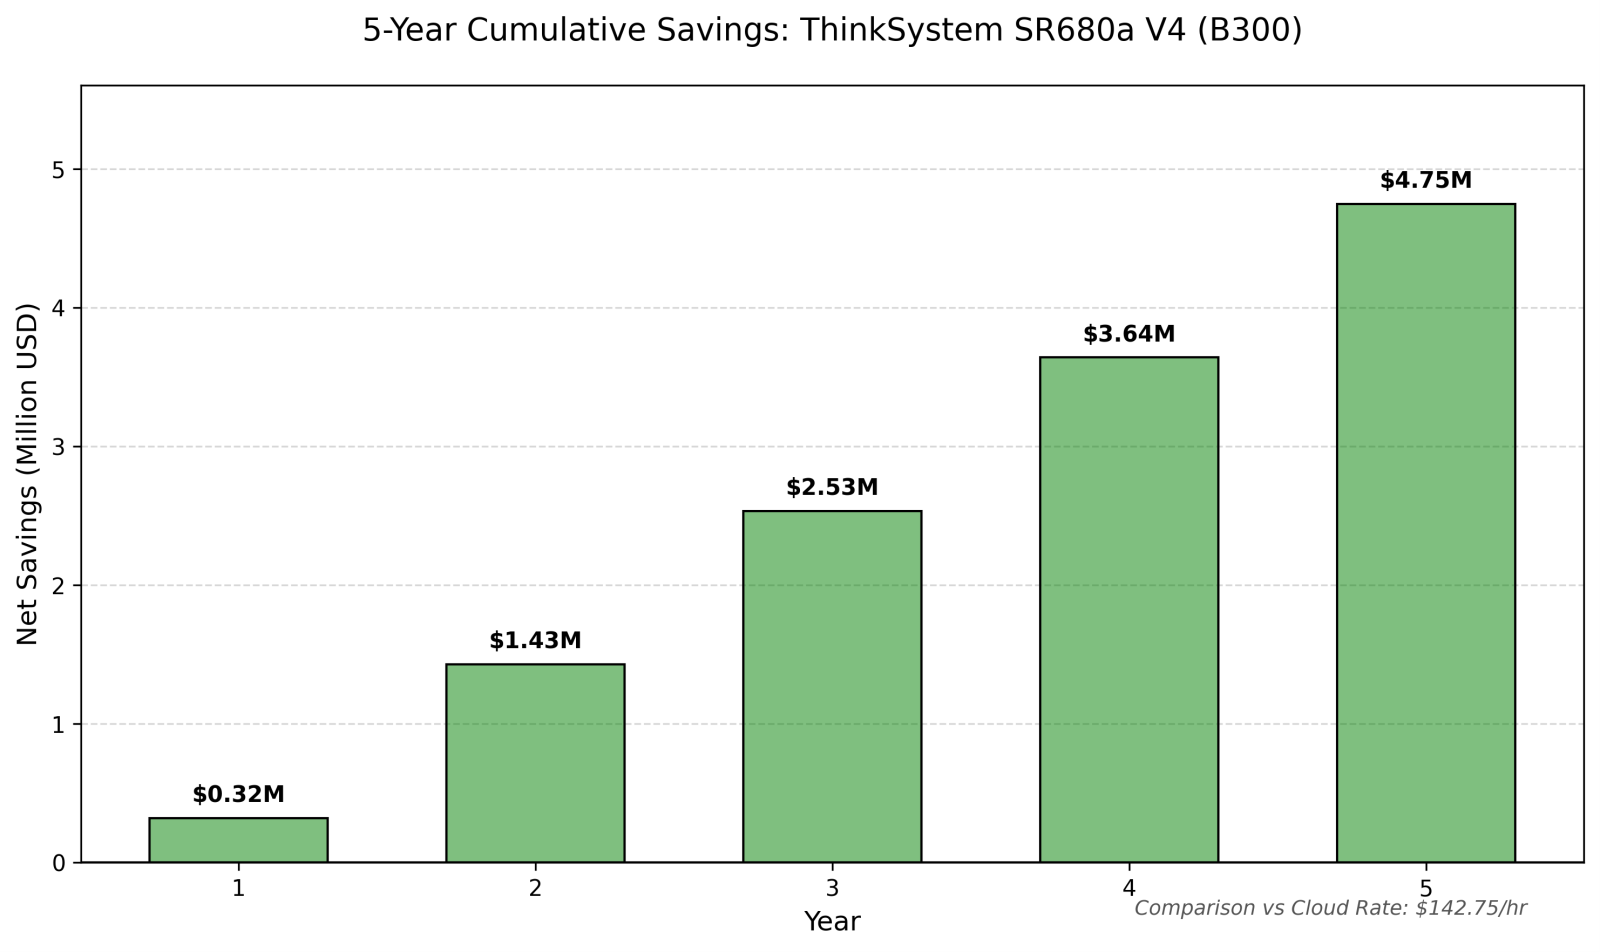
Figure 3: Cumulative Savings on 8x B300 system over a life cycle
Case 3: Hourly Utilization Threshold
Scenario: Comparing Config C (8x B200)againstAWS p6-b200.48xlarge. At what daily utilization does owning become cheaper than renting?
- Cloud Rate (AWS On-Demand): $114.27/hr
- On-Prem Cost (Config B):
- CapEx: $550,475.1
- OpEx (Hourly): $12.84 ($7.54 maintenance + $3.22 power and cooling + $2.08 colocation)
- Total 5-Year On-Prem Cost (Always On): 550,475.1 + (12.84 x 43,800) = $1,112,867.1
Calculation:
Total OnPrem Cost = Cloud Hourly × Hours/Day × 365 × 5
1,112,867.1 = 114.27 × H × 1825
1,112,867.1 = 208542.75 × H
⇒ H ≈ 5.3 hours/day
Insight: If the system is used for just 5.3 hours per day, purchasing the Lenovo SR680a V3 is more economical than renting from Google Cloud over a 5-year period.
In the following figure, we see the total savings or loss associated with utilization and the threshold which becomes the tipping point.
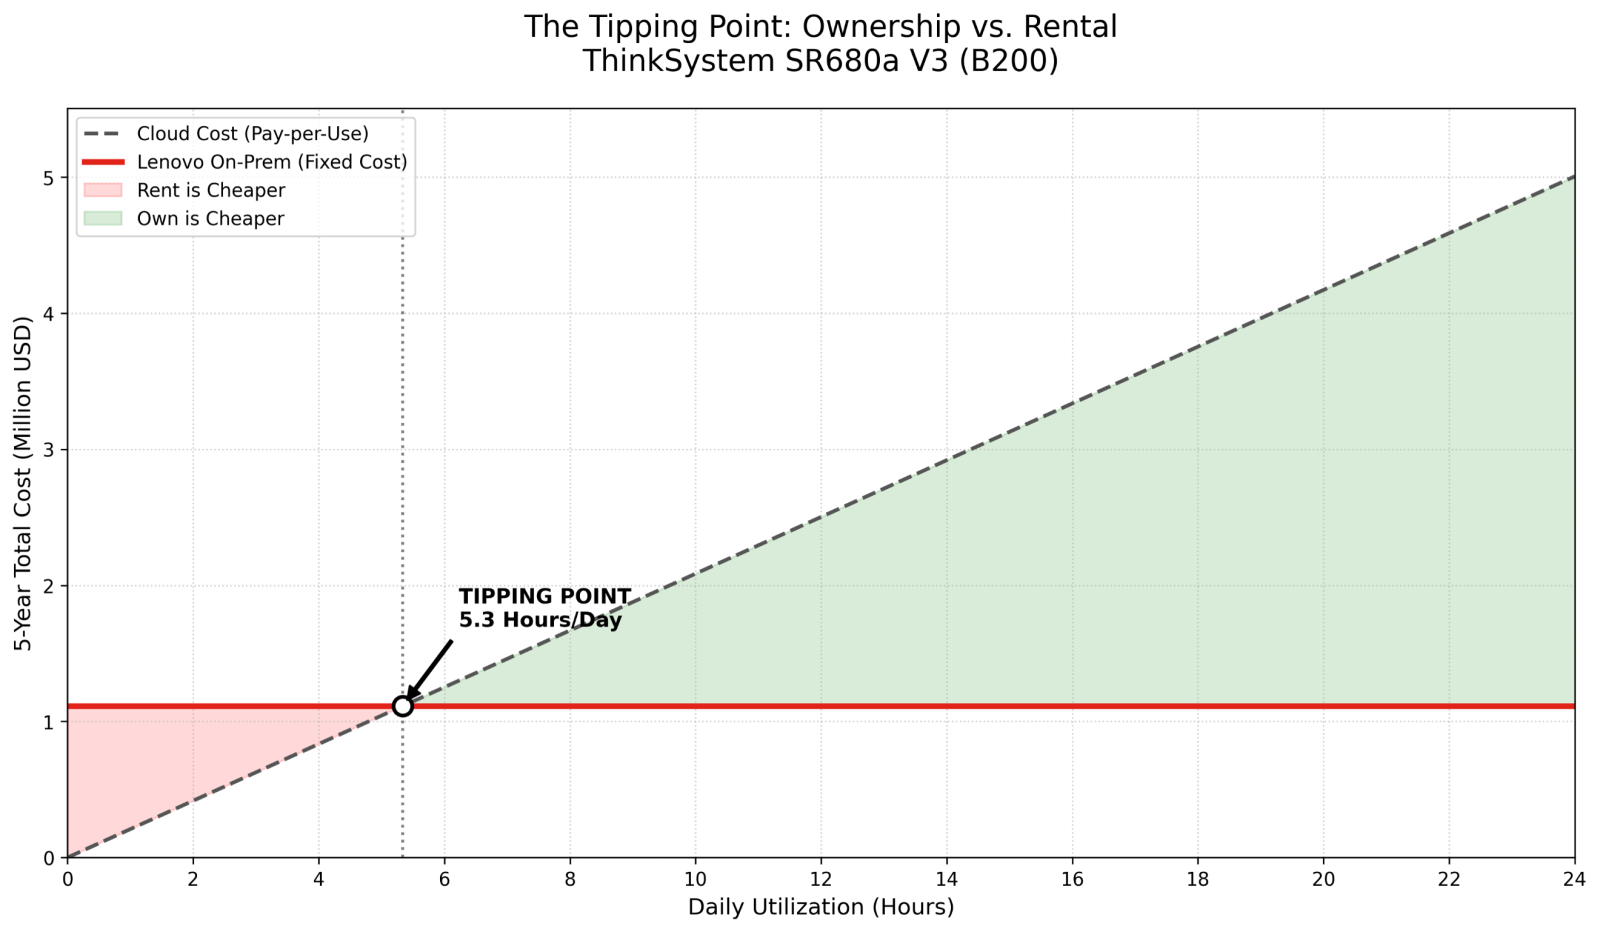
Figure 4: Utilization Threshold for on-prem systems to breakeven
Token Economics
In this section, we apply the financial data to the actual throughput capabilities of these systems. We utilize MLPerf Server inference speeds to establish a realistic baseline for output token generation.
MLPerf Inference Benchmarks (Output Tokens/Sec)
MLPerf benchmarks serve as a cruicial impartial platform to compare systems and their throughput on different GenAI models among others. The following table provides a comprehensive overview with results taken from MLPerf Server Inference (v5.0/v5.1) .
* These speeds represent raw output token throughput from MLPerf Inference Benchmarking. Actual system pipelines may introduce latency or overhead that affects these speeds, but the relative performance delta between systems remains consistent.
The following figure showcases the generational leap from Hopper to Blackwell resulting in more than 3x speedup in throughput for the same model.
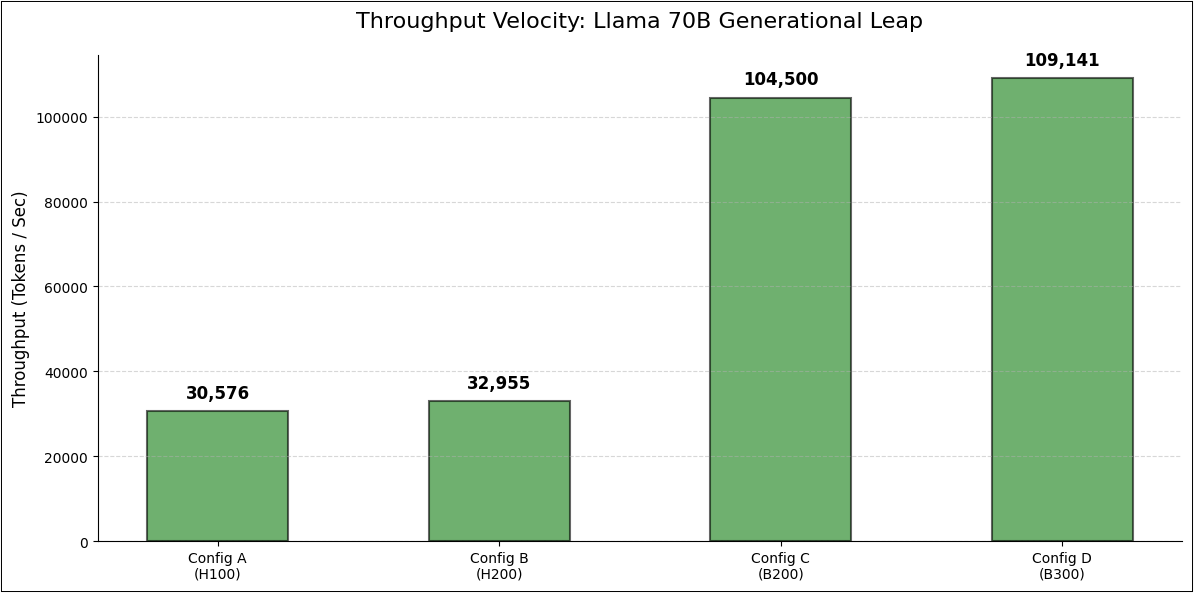
Figure 5. Throughput speeds compared across generations for 70B model
Cost Per Million Tokens Analysis
Using the 5-year amortized costs calculated in the Total Cost of Ownership (TCO) Analysis section, we can determine the cost to generate 1 million tokens for specific high-value models.
Scenario A: Llama 70B Inference (Config B vs Azure H200)
- Lenovo Config B (8x H200):
- Hourly Cost (Amortized): $18.88
- Speed: 32,955 tokens/sec
- Cost per 1M Tokens: 1M/32955 * 18.88/3600 = $0.159
- Azure H200 (On-Demand):
- Hourly Rate: $114.65
- Speed: 32,955 tokens/sec (Assumed parity)
- Cost per 1M Tokens: $0.97
- Result: 6x Cheaper On-Prem
- Proprietary API Comparison
- GPT-5.4 nano API: ~$1.25 / 1M output tokens
- Lenovo Config B (70B Model): $0.159 / 1M output tokens (8x Cheaper)
The results in the figure below show consistently that on-prem systems come out to be the cheapest for serving models compared to the cloud counterparts. Also, the cheapest frontier model still is orders of magnitude costlier than in-house, privately hosted models.
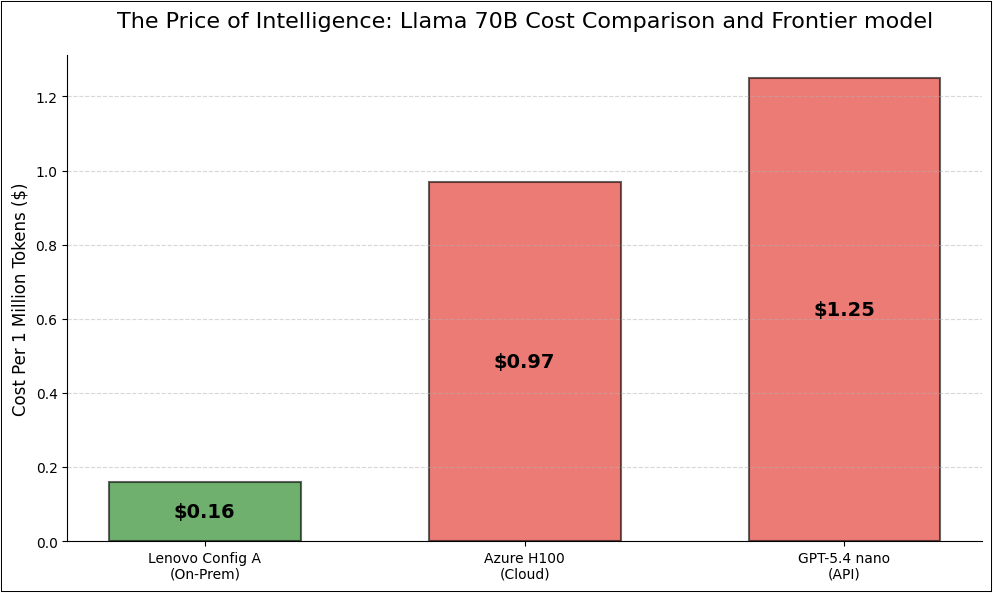
Figure 6: Cost per million token comparison between on-prem vs cloud vs frontier model
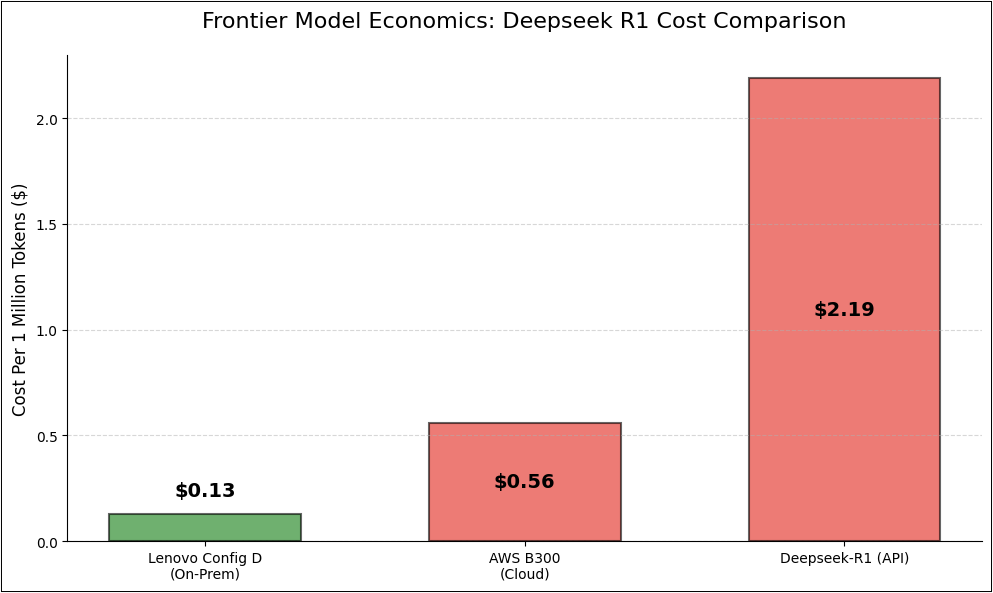
Scenario B: Deepseek R1 Reasoning Inference (Config D vs AWS B300)
- Lenovo Config D (8x B300):
- Hourly Cost (Amortized): $34.37
- Speed: 70,000 tokens/sec
- Cost per 1M Tokens: 1M/70000 * 34.37/3600 = $0.13
- AWS B300 (On-Demand):
- Hourly Rate: $142.75
- Speed: 70000 tokens/sec
- Cost per 1M Tokens: $0.56
- Deepseek-R1 API pricing
- Cost per 1M (output) tokens: $2.19 (17x expensive)
We see that Blackwell generation has significantly improved the cost per million tokens compared to Hopper generation and on-prem solution still saves 4.3x compared to Cloud reserved instance and 17x compared to API pricing!
Real-World Validation: Onetera and the Lenovo On-Premises AI Platform
The economic models built throughout this paper are not theoretical; they are actively being validated in production. Onetera, a member of the Lenovo AI Innovators program, has deployed its AI-native municipal operating system on dedicated Lenovo ThinkSystem SR675 V3 infrastructure, providing an empirical benchmark for enterprise TCO.
The Workload: Agentic AI for Regulated Environments
Onetera manages sensitive data (PII, financial records, and legal property documents) for municipal governments, making data sovereignty an absolute operational prerequisite rather than a simple preference. Furthermore, their workflows are deeply agentic, relying on complex multi-step reasoning, retrieval-augmented generation (RAG), and document analysis.
- Sustained Token Volume: A single conversational interaction or automated FAQ routing call processes thousands of tokens. When executing deep document analysis (such as extracting structured data from building plans via vision and OCR), a single call can exceed 12,000 tokens, with a full automated processing run reaching upwards of 72,000 tokens.
- Hardware Utilization: Validated in the Lenovo AI Center of Excellence Lab, Onetera’s core engine operates on a single ThinkSystem SR675 V3 node packing 8x NVIDIA RTX PRO 6000 GPUs (768 GB total VRAM). During a 40-day production pilot, a single active GPU effortlessly absorbed the initial baseline traffic with zero out-of-memory (OOM) failures, leaving 7 remaining GPUs completely clear as massive headroom for enterprise scaling.
Empirical Token Economics & Savings
The production data demonstrates an undeniable cost advantage when moving away from cloud-hosted "rented" intelligence:
- Massive API Cost Reductions: By self-hosting optimized models (such as Nemotron configurations), Onetera compressed the cost of high-volume document vision analysis and chat wrappers from $4.75 per million tokens on frontier cloud APIs down to just $0.10 to $0.15 per million tokens on-premises—a staggering 97% to 98% reduction in direct token expenses.
- 90% Drop in Processing Costs: Standard OCR tasks were slashed from $2.00 per 1,000 pages via proprietary cloud services to just $0.20 per 1,000 pages on Lenovo hardware.
- Absolute Infrastructure Savings: When compared to the alternative of renting equivalent dedicated, sovereign cloud GPU capacity ($12,000 to $18,000 per month), owning the ThinkSystem SR675 V3 slashes ongoing infrastructure spend by 60% to 70%.
Sustainable AI & Green Computing
As AI data center power consumption is projected to double by 2028, efficiency is no longer optional—it is operational.
- Liquid Cooling Efficiency: Lenovo's Neptune™ liquid cooling technology (available in the SR680a V4) significantly reduces the PUE (Power Usage Effectiveness) from the industry average of 1.5 down to 1.1. This reduction in cooling overhead directly lowers the "fully burdened" kWh cost used in our calculations, potentially improving TCO by an additional 10-15%.
- Carbon Impact: By running dedicated, high-utilization clusters on-premise, organizations can schedule training jobs during off-peak hours when the grid is greener and cheaper, a flexibility often penalized by "on-demand" cloud pricing models.
Conclusion
As we move through 2026, the economic case for on-premises Generative AI infrastructure has solidified. The era of "cloud-first" for all AI workloads is over. While the cloud remains essential for bursty training and experimentation, the Total Cost of Ownership analysis decisively favors on-premises infrastructure for sustained inference and fine-tuning workloads.
- Breakeven: Achieved in <6 months for high-utilization environments against On-Demand pricing.
- Token Cost: Self-hosting on Lenovo hardware offers an 6x cost advantage per million tokens compared to Cloud IaaS, and up to 17x compared to frontier Model-as-a-Service APIs.
- Lifecycle: Over a standard 5-year lifecycle, the savings per server can reach nearly $5 million, freeing up massive capital for further innovation.
For enterprises committed to AI as a core competitive advantage, the transition from renting intelligence to owning the factory is not just a technical evolution, it is a financial imperative. If you want access to all assumptions and calculations, leave a comment via the Rate & Provide Feedback link at the top of the page.
Authors
Sachin Gopal Wani is a Staff Data Scientist at Lenovo, working on end-to-end Machine Learning (ML) applications for varying customers. He has published articles on the sizing guide and provides sizing information for customers. Sachin holds extensive experience in AI solutions including LLMs, and Computer Vision. He graduated from Rutgers University as a gold medalist specializing in ML and has secured the J.N. Tata Scholarship.
David Ellison is the Chief Data Scientist for Lenovo ISG. Through Lenovo’s US and European AI Discover Centers, he leads a team that uses cutting-edge AI techniques to deliver solutions for external customers while internally supporting the overall AI strategy for the Worldwide Infrastructure Solutions Group. Before joining Lenovo, he ran an international scientific analysis and equipment company and worked as a Data Scientist for the US Postal Service. Previous to that, he received a PhD in Biomedical Engineering from Johns Hopkins University. He has numerous publications in top tier journals including two in the Proceedings of the National Academy of the Sciences.
Jarrett Upton is the AI Center of Excellence Lab Manager, where he leads the deployment and demonstration of cutting-edge AI solutions. With a strong focus on enabling customer proof-of-concept testing and validating independent software vendor (ISV) integrations. Jarrett plays a pivotal role in accelerating enterprise adoption of AI technologies. He oversees the design and operations of Lenovo’s AI Lab, driving innovation and collaboration across product teams, partners, and clients.
Trademarks
Lenovo and the Lenovo logo are trademarks or registered trademarks of Lenovo in the United States, other countries, or both. A current list of Lenovo trademarks is available on the Web at https://www.lenovo.com/us/en/legal/copytrade/.
The following terms are trademarks of Lenovo in the United States, other countries, or both:
Lenovo®
Neptune®
ThinkSystem®
The following terms are trademarks of other companies:
Intel®, the Intel logo and Xeon® are trademarks of Intel Corporation or its subsidiaries.
Azure is a trademark of Microsoft Corporation in the United States, other countries, or both.
NVIDIA®, Nemotron, and NVIDIA RTX® are trademarks of NVIDIA Corporation.
Other company, product, or service names may be trademarks or service marks of others.
Configure and Buy
Please select a locale
Full Change History
Changes in the July 24, 2026 update:
- Updated financial calculations to reflect latest pricing for on-premise and cloud implementations
- Added new models in the Token Economics section
- Added Onetera as a customer reference story - Real-World Validation: Onetera and the Lenovo On-Premises AI Platform
First published: February 4, 2026
Course Detail
Employees Only Content
The content in this document with a is only visible to employees who are logged in. Logon using your Lenovo ITcode and password via Lenovo single-signon (SSO).
The author of the document has determined that this content is classified as Lenovo Internal and should not be normally be made available to people who are not employees or contractors. This includes partners, customers, and competitors. The reasons may vary and you should reach out to the authors of the document for clarification, if needed. Be cautious about sharing this content with others as it may contain sensitive information.
Any visitor to the Lenovo Press web site who is not logged on will not be able to see this employee-only content. This content is excluded from search engine indexes and will not appear in any search results.
For all users, including logged-in employees, this employee-only content does not appear in the PDF version of this document.
This functionality is cookie based. The web site will normally remember your login state between browser sessions, however, if you clear cookies at the end of a session or work in an Incognito/Private browser window, then you will need to log in each time.
If you have any questions about this feature of the Lenovo Press web, please email David Watts at dwatts@lenovo.com.


