

Top
Author
Published
20 Mar 2026Form Number
LP2401PDF size
39 pages, 686 KBSubscribed to LP2401.
Thank you for your feedback.
Table of Contents
Abstract
In VMware vSphere environments, storage incidents often manifest through generic symptoms such as increased latency, stalled virtual machines, or unresponsive hosts. These symptoms alone provide limited diagnostic value and can significantly delay root cause identification. SCSI sense codes, defined by the T10 SCSI Primary Commands (SPC) standard, offer precise and structured diagnostic information that captures the state of an I/O operation at the time of failure.
This paper proposes a deterministic and standards-aligned diagnostic model for interpreting SCSI sense codes in VMware vSphere environments. It clarifies how Host Status, Device Status, Plugin Status, and detailed sense data – including Sense Key, Additional Sense Code (ASC), and Additional Sense Code Qualifier (ASCQ) – interact to differentiate host-level, fabric-level, and storage-target conditions. The paper further highlights the role of SCSI sense data in identifying critical vSphere storage failure states such as All Paths Down (APD) and Permanent Device Loss (PDL).
By applying accurate sense code interpretation, administrators can move from symptom-based troubleshooting to evidence-based diagnosis methodology, thereby reducing Mean Time to Resolution (MTTR) and improving coordination across virtualization, storage, and networking teams.
Introduction
Reliable storage operations in a VMware vSphere environment depend on consistent and standards-compliant communication between the ESXi VMkernel and backend storage devices. When an I/O operation cannot be completed successfully, ESXi records SCSI Sense Codes—structured diagnostic information defined by the T10 SCSI Primary Commands (SPC) specification. These codes capture the state of the command at the moment of failure and offer deterministic insight into the nature and location of the problem.
This paper presents a technically rigorous and vendor-neutral framework for interpreting SCSI sense codes in VMware vSphere environments. By understanding the relationship between Host Status, Device Status, Plugin Status, and detailed sense data (Sense Key, ASC, and ASCQ), administrators can accurately distinguish between host-level, fabric-level, and array-level conditions. This structured interpretation significantly accelerates root cause identification, reduces Mean Time to Resolution (MTTR), and strengthens collaboration across virtualization, storage and networking teams.
Anatomy of a SCSI I/O Failure
The following figure illustrates the end-to-end path of a SCSI I/O request in VMware vSphere, flowing from the guest OS through the virtual SCSI controller and ESXi PSA stack down to the HBA and storage array, where the final device, host, and sense statuses are generated.
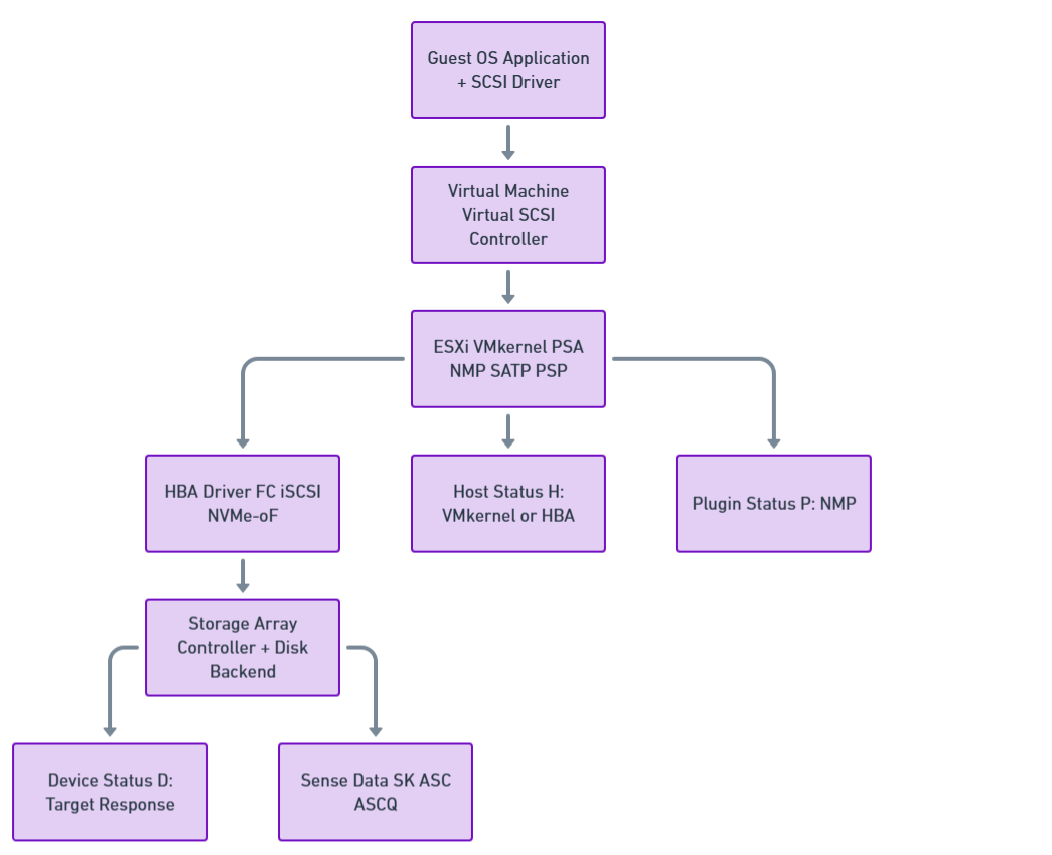
Figure 1. End-to-End SCSI I/O Architecture in VMware vSphere
An I/O request issued by an application inside a virtual machine traverses multiple layers of the vSphere storage stack before reaching persistent storage. These layers include:
- Guest operating system and virtual SCSI driver
- Virtual SCSI controller
- ESXi VMkernel storage stack
- Physical Host Bus Adapter (HBA)
- Storage transport (Fibre Channel, iSCSI, or NVMe-oF)
- Target storage device
SCSI status code
When the target storage device cannot process the command successfully, it returns a SCSI status code. When the status code indicates CHECK CONDITION, the initiator (ESXi) issues a REQUEST SENSE operation to retrieve detailed sense data describing the error.
In the ESXi vmkernel.log, a typical SCSI error entry appears in the following format:
H:0xX D:0xX P:0xX Valid sense data: 0xX 0xX 0xX
Each field represents a different layer of error reporting, progressing from host-side handling to device-reported diagnostic data.
The three hexadecimal status values provide information from different layers of the storage stack:
- H: (Host Status) - How the ESXi storage stack or HBA processed the command
- D: (Device Status) - The SCSI status code returned by the target storage device
- P: (Plugin Status) - The Native Multipathing Plugin (NMP) status
The following subsections detail each of these:
Host Status (H:) - ESXi and HBA Perspective
The Host Status value describes how the ESXi storage stack or the host bus adapter (HBA) processed the command before a device-level response was received.
- 0x0 (DID_OK)
The command was successfully delivered to the target device and a response was received. - 0x1 (DID_NO_CONNECT)
The host was unable to establish connectivity with the target. Typical causes include physical link failures, incorrect zoning or ACL configuration, failed transceivers, or unavailable target ports. - 0x3 (DID_TIME_OUT)
The command timed out without receiving a device response. This condition commonly indicates fabric congestion, path instability, or an unresponsive storage controller. - 0x5 (DID_ABORT)
The command was aborted by the host. This typically caused by a higher-priority recovery action such as a LUN reset, device reset, or path failover events. - 0x7 (DID_ERROR)
A generic host adapter error occurred. This status is often associated with HBA driver, firmware, or hardware issues rather than a storage media fault.
For more information on host-side NMP errors, see VMware Knowledge Base Article 1029039.
Device Status (D:) - Storage Target Perspective
The Device Status represents the SCSI status code returned by the target storage device. This section provides comprehensive coverage of all standard SCSI device status codes that may appear in VMware ESXi environments.
- 0x0 (VMK_SCSI_DEVICE_GOOD)
- 0x2 (VMK_SCSI_DEVICE_CHECK_CONDITION)
- 0x4 (VMK_SCSI_DEVICE_CONDITION_MET)
- 0x8 (VMK_SCSI_DEVICE_BUSY)
- 0x18 (VMK_SCSI_DEVICE_RESERVATION_CONFLICT)
- 0x28 (VMK_SCSI_DEVICE_QUEUE_FULL / TASK SET FULL)
- 0x30 (VMK_SCSI_DEVICE_ACA_ACTIVE)
- 0x40 (VMK_SCSI_DEVICE_TASK_ABORTED)
- Vendor-Specific Device Status Codes
0x0 (VMK_SCSI_DEVICE_GOOD)
Example:
vmkernel: 116:03:44:19.039 cpu4:4100)NMP: nmp_CompleteCommandForPath: Command 0x2a (0x4100020e0b00) to NMP device "sym.029010111831353837" failed on physical path "vmhba2:C0:T0:L152" H:0x2 D:0x0 P:0x0 Possible sense data: 0x0 0x0 0x0.
This status is returned when there is no error from the device or target side. When D:0x0 appears, you can examine the Host Status (H:) or Plugin Status (P:) fields for the actual cause of the failure.
0x2 (VMK_SCSI_DEVICE_CHECK_CONDITION)
Example:
vmkernel: 76:23:45:36.239 cpu11:22687)NMP: nmp_CompleteCommandForPath: Command 0x28 (0x41000b10f000) to NMP device "naa.600601601f70190016361881f3b4de11" failed on physical path "vmhba3:C0:T2:L10" H:0x0 D:0x2 P:0x0 Valid sense data: 0x2 0x4 0x3.
This status is returned when a command fails for a specific reason. When CHECK CONDITION is returned, the ESX storage stack sends a SCSI command 0x3 (REQUEST SENSE) to retrieve the SCSI sense data (Sense Key, Additional Sense Code, ASC Qualifier). The sense data is listed after "Valid sense data" in the order of Sense Key, Additional Sense Code, and ASC Qualifier.
Breakdown of the example above:
- Host Status = 0x0 = OK
- Device Status = 0x2 = Check Condition
- Plugin Status = 0x0 = OK
- Sense Key = 0x2 = NOT READY
- Additional Sense Code/ASC Qualifier = 0x4/0x3 = LOGICAL UNIT NOT READY - MANUAL INTERVENTION REQUIRED
0x4 (VMK_SCSI_DEVICE_CONDITION_MET)
Example:
vmkernel: 0:00:42:28.062 cpu5:4112)ScsiDeviceIO: SCSIAsyncDeviceCommand:2077: Error Inject: Command 0x2a to device "naa.600601600f6021002cfb75ea2bc6de11" failed H:0x0 D:0x4 P:0x0
This status is returned for successful completion of conditional commands, such as PREFETCH. This is a success status and typically does not indicate a problem.
0x8 (VMK_SCSI_DEVICE_BUSY)
Example:
vmkernel: 1:02:02:02.206 cpu3:4099)NMP: nmp_CompleteCommandForPath: Command 0x28 (0x410005078e00) to NMP device "naa.6001e4f000105e6b00001f14499bfead" failed on physical path "vmhba1:C0:T0:L100" H:0x0 D:0x8 P:0x0 Possible sense data: 0x0 0x0 0x0.
This status is returned when a LUN cannot accept SCSI commands at the moment. As this condition is normally transient, the command is retried; however, persistent BUSY responses may indicate controller resource saturation or queue depth misconfiguration.
0x18 (VMK_SCSI_DEVICE_RESERVATION_CONFLICT)
Example:
vmkernel: 1:08:40:03.933 cpu5:4736)ScsiDeviceToken: 115: Completed IO with status H:0x0 D:0x18 P:0x0 after losing reservation on device naa.6006016026601d007c174a7aa292df11
This status is returned when a LUN is in a Reserved status and commands from initiators that did not place that SCSI reservation attempt to issue commands to it. This condition is most observed in legacy or mixed-host environments using SCSI-2 reservations.
Note: You will rarely see a device status of 0x18 in the standard format shown above. RESERVATION CONFLICT messages are more commonly seen in other log formats specific to reservation handling.
0x28 (VMK_SCSI_DEVICE_QUEUE_FULL / TASK SET FULL)
Example:
vmkernel: 1:08:42:28.062 cpu3:8374)NMP: nmp_CompleteCommandForPath:2190: Command 0x16 (0x41047faed080) to NMP device "naa.600508b40006c1700001200000080000" failed on physical path "vmhba39:C0:T1:L16" H:0x0 D:0x28 P:0x0 Possible sense data: 0x0 0x0 0x0.
This status is returned when the LUN prevents accepting SCSI commands from initiators due to lack of resources, namely the queue depth on the array.
Adaptive Queue Depth: Adaptive queue depth code was introduced into ESX 3.5 U4 (native in ESX 4.x and later) that adjusts the LUN queue depth in the VMkernel. If configured, this code activates when device status TASK SET FULL (0x28) is returned for failed commands and throttles back the I/O until the array stops returning this status.
For more information, see the "Controlling LUN queue depth throttling in VMware ESXi" section in VMware Knowledge Base Article 1008113.
0x30 (VMK_SCSI_DEVICE_ACA_ACTIVE)
Example:
vmkernel: 0:00:14:08.673 cpu2:4098)NMP: nmp_CompleteCommandForPath: Command 0x25 (0x41013f5b4a40) to NMP device "naa.60060160f1c01400d2731d49473edd11" failed on physical path "vmhba2:C0:T1:L0" H:0x0 D:0x30 P:0x0 Possible sense data: 0x0 0x0 0x0.
This status is returned when an Auto Contingent Allegiance (ACA) has been aborted by another SCSI initiator. This status has been observed on arrays running older/unsupported firmware with ESX 4.1, specifically when the firmware does not support VAAI commands.
For more information on VAAI, see the "vStorage APIs for Array Integration FAQ" section in VMware Knowledge Base Article 1021976.
0x40 (VMK_SCSI_DEVICE_TASK_ABORTED)
Example:
vmkernel: 1:01:32:19.519 cpu6:4102)NMP: nmp_CompleteCommandForPath: Command 0x2a (0x4100062e7d00) to NMP device "naa.60a9800043346534645a43396a6c524d" failed on physical path "vmhba3:C0:T0:L23" H:0x0 D:0x40 P:0x0 Possible sense data: 0x0 0x0 0x0.
This status is returned when a command has been aborted by another SCSI initiator and the TASK ABORT STATUS bit is set to '1'. So far this status has only been returned by iSCSI arrays.
Vendor-Specific Device Status Codes
Any device status value not covered in this list would be vendor-specific. If a vendor-specific condition is encountered, contact the storage vendor support team for interpretation.
Plugin Status (P:) - NMP Perspective
The Plugin Status represents the Native Multipathing Plugin (NMP) status. A value of 0x0 indicates that NMP successfully processed the I/O operation from a multipathing perspective. Non-zero values may indicate path selection issues or multipathing-specific errors.
Interpreting Sense Data (Sense Key / ASC / ASCQ)
When a device returns CHECK CONDITION (D:0x2), ESXi logs a triplet of hexadecimal values known collectively as sense data. These values are defined by the T10 SCSI Primary Commands (SPC) specification and provide a structured, hierarchical description of the error condition.
The interpretation process should always begin with the Sense Key, followed by the ASC and ASCQ, which together provide detailed context.
The following figure shows how a SCSI error is analyzed by checking device status, retrieving sense data, classifying the sense key, and determining whether the issue is a transport failure, data error, or permanent device loss.
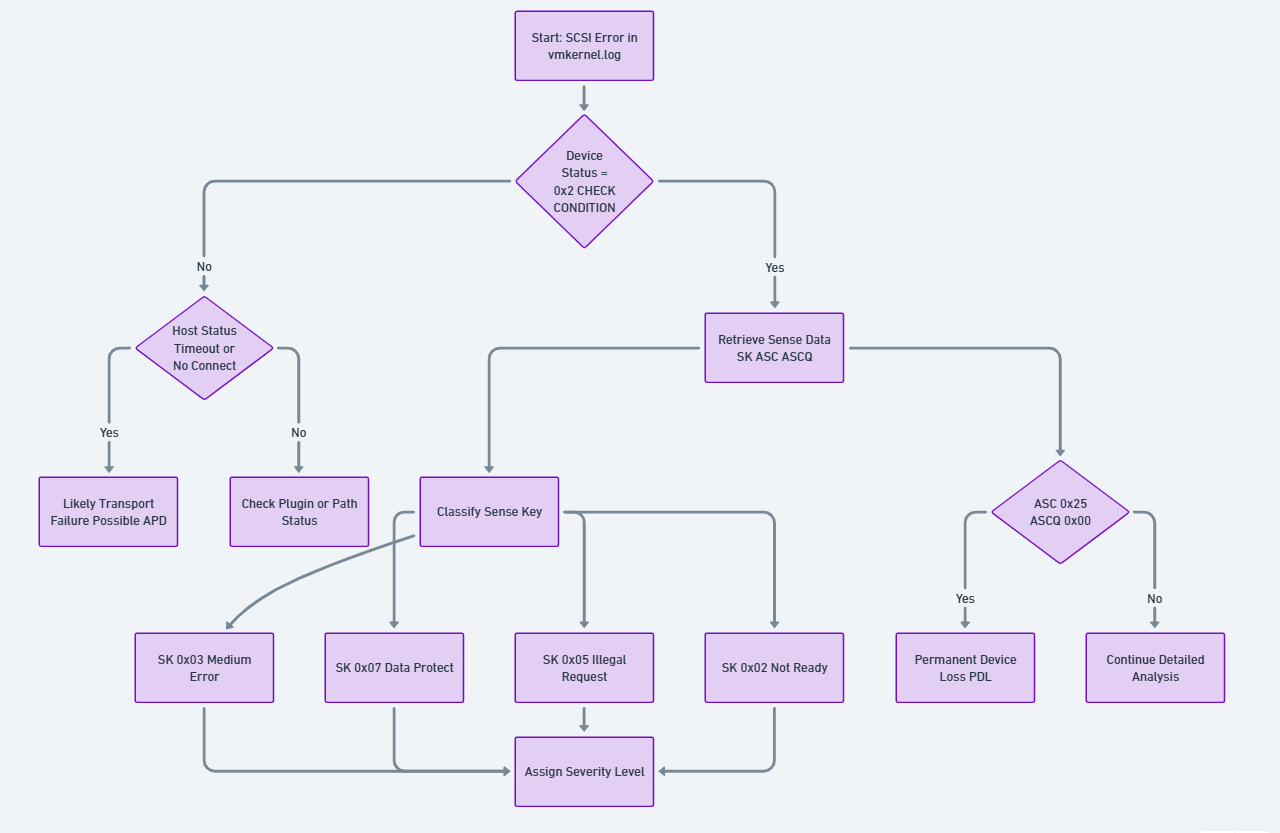
Figure 2. Deterministic SCSI Status Interpretation Flow
The following sections describe the three core components used in the SCSI error interpretation workflow illustrated in the chart above. Each element plays a distinct role in determining how ESXi classifies, interprets, and responds to storage level failures. Sense Keys provide the high level classification of an error, ASC/ASCQ values supply precise detail on the underlying condition, and SCSI Command Operation Codes identify which command was in progress when the error occurred. Understanding how these three fields interact is essential for decoding vmkernel.log entries and for diagnosing conditions such as APD, PDL, medium errors, or protocol level faults.
Sense Key (SK) - Error Classification
The Sense Key identifies the general category of the error condition.
- 0x02 (NOT READY)
The logical unit is present but not currently accessible. Typical causes include initialization in progress, the device being placed offline, or a condition requiring administrative action.
- 0x03 (MEDIUM ERROR)
An unrecoverable error occurred while accessing the physical media. This indicates that the requested operation could not be completed successfully at the device level.
- 0x05 (ILLEGAL REQUEST)
The initiator issued a command that is not supported by the target storage device or provided invalid parameters. This condition may also indicate incorrect LUN mapping or unsupported offload operations.
- 0x06 (UNIT ATTENTION)
A non-fatal condition indicating that the device state has changed since the last command, such as after a reset, controller failover, or configuration update.
- 0x07 (DATA PROTECT)
The command failed due to write protection or access restrictions, including allocation or space-related limitations.
Additional Sense Code (ASC) and ASCQ - Error Detail
The ASC and ASCQ provide precise details describing the specific reason for the error condition.
ASC and ASCQ values are extensive and, in some cases, may be vendor-specific. When discrepancies arise, storage vendor documentation and VMware guidance should be treated in conjunction with the SPC standard.
For a complete list of possible Sense Keys, see SCSI Sense Keys
For a complete list of Additional Sense Code/ASC Qualifier pairings, see ASC-NUM.TXT
SCSI Command Operation Codes
When reviewing error logs, you may encounter references to SCSI command operation codes (opcodes). These hexadecimal values identify the specific SCSI command that was being executed when the error occurred.
Common Operation Code Example
Opcode 0x28 (READ(10))
vmkernel: 12:17:46:05.000 cpu12:4108)ScsiCore: 1181: Sync CR (opcode 28) at 992 (wid4121)
The opcode 0x28 represents a 10-byte READ command typically issued by a virtual machine to read data from storage.
Other Common Opcodes:
- 0x2A - WRITE(10)
- 0x12 - INQUIRY
- 0x25 - READ CAPACITY(10)
- 0x3 - REQUEST SENSE
For more information on SCSI Command Operation Codes, see OP-NUM
Critical Failure States in VMware vSphere: APD and PDL
Correct interpretation of SCSI sense data is essential for distinguishing between two critical storage failure states in VMware vSphere: All Paths Down (APD) and Permanent Device Loss (PDL). Understanding these conditions is crucial because they require different response strategies and have different implications for virtual machine availability.
The following figure illustrates the decision making process ESXi follows when a datastore becomes inaccessible and the host must determine whether the condition represents a Partial Path Failure, an All Paths Down (APD) event, or a Permanent Device Loss (PDL) condition.
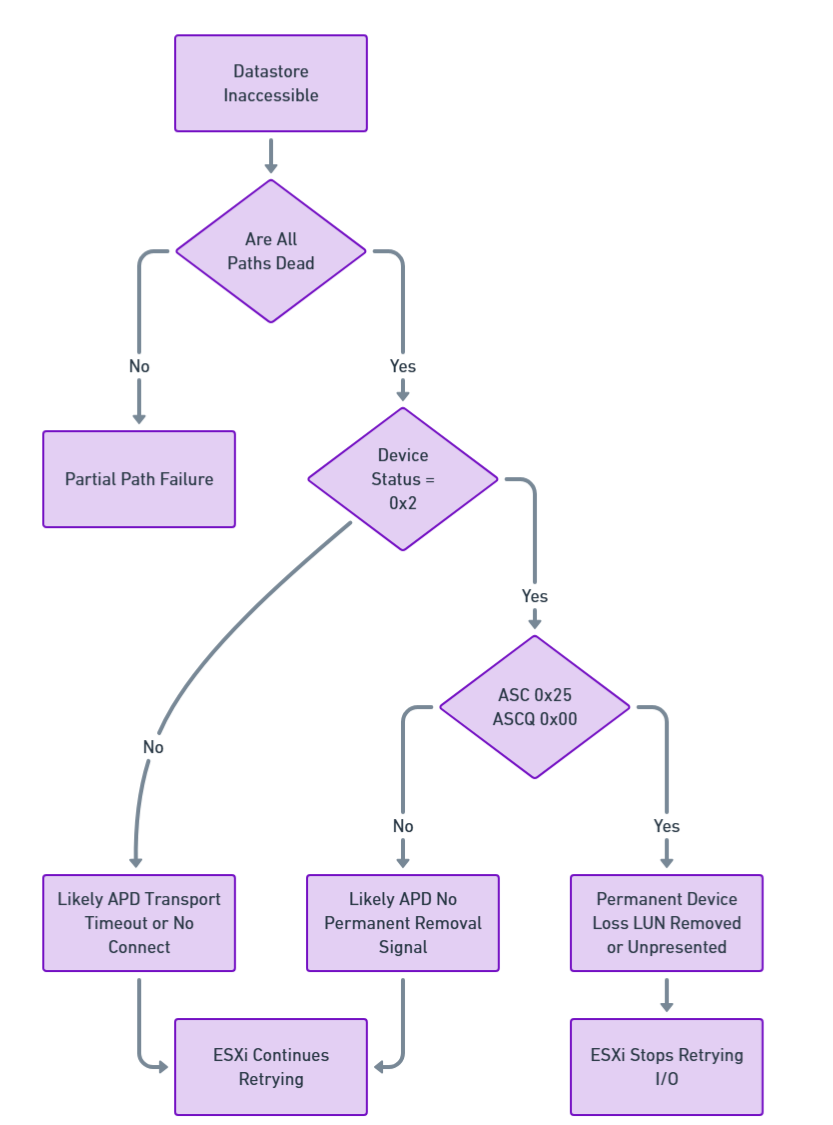
Figure 3. APD vs PDL Decision Tree Model
Both APD and PDL conditions can cause similar symptoms in vSphere environments:
- ESXi hosts may become unresponsive
- Datastores might disconnect
- Virtual machines might become unresponsive, invalid, or orphaned
The key difference lies in whether the storage array explicitly signals permanent device loss using specific SCSI sense codes.
The following sections introduce the two primary storage connectivity failure states encountered in VMware vSphere environments: All Paths Down (APD) and Permanent Device Loss (PDL). Although both events disrupt datastore accessibility and can produce similar symptoms, they originate from fundamentally different storage layer conditions. These subsections explain the nature of each failure mode, how ESXi interprets SCSI layer signals, and what operational behavior administrators can expect when these conditions occur.
All Paths Down (APD)
All Paths Down (APD) occurs when an ESXi host loses all active paths to a storage device, but the storage array does not explicitly indicate that the device has been permanently removed. Because no Permanent Device Loss (PDL) SCSI sense codes are returned, ESXi cannot determine whether the outage is temporary or permanent.
Behavior and Impact:
- The datastore appears unavailable in the vSphere Client.
- All paths to the device are marked as Dead.
- The storage adapter may show the device state as Dead or Error.
- ESXi continues retrying I/O operations indefinitely.
- Host management agents may become unresponsive.
- Virtual machines accessing the datastore may hang or become unresponsive.
- vMotion, Storage vMotion, and rescans may fail while the APD condition exists.
Logging and Indicators:
- vmkernel logs show repeated I/O retry messages and blocked device warnings.
- No SCSI sense codes indicating permanent failure are present.
- Device Status typically shows 0x0 (GOOD) while Host Status shows errors, such as H:0x3 for timeout or H:0x1 for no connect.
Resolution:
- Restore connectivity at the storage, fabric, or network level.
- Once connectivity is restored, ESXi resumes normal I/O operations.
- In some cases, a host reboot may be required for full recovery.
Permanent Device Loss (PDL)
Permanent Device Loss (PDL) occurs when a storage device is permanently unavailable and the storage array explicitly informs ESXi of this condition by returning specific SCSI sense codes. This typically occurs when a LUN is intentionally removed, unpresented, or has suffered a permanent failure.
Behavior and Impact:
- The datastore becomes inaccessible or shows a size of 0 B.
- All paths to the device are marked as Dead.
- ESXi stops retrying I/O operations for the device.
- Virtual machines residing on the datastore become inaccessible.
- The storage adapter may report Lost Communication.
Logging and Indicators:
- vmkernel logs contain SCSI sense codes indicating permanent failure (for example, Logical Unit Not Supported).
- Device Status shows 0x2 (CHECK CONDITION) with specific sense data indicating permanent loss.
- vSphere Client reports that the datastore is not accessible.
Common PDL Sense Codes:
- Sense Key 0x05, ASC 0x25, ASCQ 0x00 - Logical Unit Not Supported
Resolution and Cleanup:
- Planned PDL (intentional LUN removal)
- Migrate or power off affected virtual machines.
- Unmount the datastore from all hosts.
- Detach the device.
- Remove or unpresent the LUN from the storage array.
- Unplanned PDL (unexpected failure)
- Power off or unregister affected virtual machines.
- Unmount the datastore.
- Detach the device from the ESXi host.
- Rescan storage adapters to clean up stale device entries.
Operational Best Practices
The operational best practices outlined in this section provide a practical framework for maintaining storage reliability and rapidly diagnosing issues in VMware environments. By correlating events across hosts, validating hardware offload compatibility, monitoring thin provisioned capacity, and managing queue depth behavior, administrators can proactively prevent many of the conditions that lead to service disruption.
Combining manual SCSI level interpretation with automated analysis tools ensures that both precision and scalability are achieved, enabling teams to detect patterns early and respond with confidence. Together, these practices reinforce the importance of structured diagnostics, consistent terminology, and cross team coordination—ultimately reducing MTTR and strengthening overall operational resilience.
Correlate Events Across Hosts
Identical sense codes observed simultaneously on multiple hosts often indicate a shared storage-side event such as a controller reset or failover. When troubleshooting, it is recommended to verify whether multiple hosts are affected, and then determine if the root cause originates at the host level or on the storage level.
Validate Hardware Acceleration Features
Repeated ILLEGAL REQUEST conditions (Sense Key 0x05, ASC 0x20, ASCQ 0x00) may indicate unsupported offload commands or VAAI primitives. This may occur under the following conditions:
- The array firmware does not support specific VAAI operations.
- VAAI features are enabled but not properly licensed on the array.
- There is a compatibility mismatch between ESXi version and array capabilities.
In such cases, selectively disabling affected features may improve stability. Always consult both VMware and storage-vendor compatibility matrices.
Monitor Thin-Provisioned Capacity
DATA PROTECT errors (Sense Key 0x07, ASC 0x27) indicate exhausted backing storage capacity on thin-provisioned volumes. Application-level write failures may exist at this stage. You can implement proactive capacity monitoring to avoid reaching this state.
Recommended Actions:
- Set up alerts when thin-provisioned datastores reach 75% of physical capacity.
- Regularly review storage array capacity reports.
- Configure Space Reclamation (UNMAP) policies where supported.
Monitor Queue Depth and BUSY/TASK SET FULL Conditions
Frequent BUSY (0x8) or TASK SET FULL (0x28) device status codes indicate that the storage array cannot process commands at the current rate. This may be due to:
- Insufficient queue depth configured on the array
- Controller resource saturation
- Excessive I/O workload on the storage system
Recommended Actions:
- Review and tune LUN queue depth settings using adaptive queue depth throttling.
- Analyze I/O patterns to identify workloads causing saturation.
- Balance load across multiple controllers or arrays where applicable.
- Refer to VMware KB Article 1008113 for queue-depth tuning guidance.
Combine Manual and Automated Analysis
Manual sense code interpretation should be complemented with tools and automation:
- Use esxcli storage core device stats get to gather device statistics.
- Leverage VMware Knowledge Base articles for known issues and resolutions.
- Utilize vendor-provided diagnostic utilities for array-specific analysis.
- Implement automated log analysis to identify patterns and trends.
- Develop runbooks for common error scenarios to standardize response procedures.
Sample Code - Automated Analysis
While manual interpretation of SCSI sense codes provides deep technical insight, large-scale production environments require automation to efficiently detect patterns, prioritize incidents, and reduce Mean Time to Resolution (MTTR).
To demonstrate practical implementation of the framework described in this paper, the following section describes a reference Bash-based SCSI Analyzer script we developed. The script is designed to parse VMware ESXi vmkernel.log files and decode SCSI host, device, and sense data.
The script can also be viewed below in the Appendix: scsi_analyzer.sh script section.
Note: This script is provided to you, as is, for educational purposes. No warranty is expressed or implied.
This implementation follows:
- T10 SPC standards
- VMware NMP behavior
- APD / PDL detection logic
- Queue depth and thin provisioning diagnostics
The following subsections provide a structured overview of how the SCSI Analyzer operates, from its functional purpose to its internal architecture and detection logic. These sections break down the analyzer’s capabilities—how it parses vmkernel logs, decodes SCSI fields, identifies APD/PDL conditions, and derives severity classifications. Each subheading introduces a different aspect of the tool, showing how raw SCSI telemetry is transformed into actionable diagnostic output for VMware environments. Together, they present a complete picture of the analyzer’s workflow, design principles, and operational value.
- Purpose of the Analyzer
- Script Architecture Overview
- Severity Classification Logic
- APD and PDL Detection Logic
- Output Artifacts
- Example Usage
Purpose of the Analyzer
The SCSI Analyzer script performs the following functions:
- Extracts SCSI error entries from vmkernel.log.
- Decodes the following items:
- Host Status (H:)
- Device Status (D:)
- Plugin Status (P:)
- Sense Key
- ASC / ASCQ
- Classifies the following severity levels:
- CRITICAL
- HIGH
- MEDIUM
- LOW
- Detects APD and PDL conditions.
- Generates structured analysis reports, including:
- Summary statistics
- Detailed error breakdown
- Critical incidents
- APD/PDL detection
- Error timeline
Script Architecture Overview
The analyzer is structured into modular decoding functions:
Host Status Decoder: This enables detection of transport-layer failures commonly associated with APD conditions.
Maps VMkernel H: codes such as:
- 0x0 → DID_OK
- 0x3 → DID_TIME_OUT
- 0x1 → DID_NO_CONNECT
Device Status Decoder: This layer identifies array-side signaling behavior.
Interprets D: codes such as:
- 0x2 → CHECK CONDITION
- 0x28 → TASK SET FULL
- 0x18 → RESERVATION CONFLICT
Sense Data Decoder: This mirrors the hierarchical decoding model presented earlier in this paper.
When CHECK CONDITION is detected, the script extracts:
Valid sense data: SK ASC ASCQ
Example mapping:
- 0x02 / 0x04 / 0x03 → Logical Unit Not Ready – Manual Intervention Required
- 0x05 / 0x25 / 0x00 → Logical Unit Not Supported (PDL)
- 0x07 / 0x27 / 0x07 → Thin provisioning space exhaustion
Severity Classification Logic
The script includes deterministic logic for classifying error severity. This structured prioritization allows operations teams to focus on service-impacting conditions first.
CRITICAL
Triggered when:
- ASC 0x25 / ASCQ 0x00 → PDL detected
- Host timeout (H:0x3) + Device GOOD (D:0x0) → APD pattern
HIGH
Includes:
- MEDIUM ERROR (SK 0x03)
- TASK SET FULL (D:0x28)
- DATA PROTECT (SK 0x07)
MEDIUM
Includes:
- RESERVATION CONFLICT
- DEVICE BUSY
- ILLEGAL REQUEST (VAAI mismatch)
LOW
Includes:
- UNIT ATTENTION (controller reset, failover)
APD and PDL Detection Logic
The script explicitly distinguishes:
APD Pattern
- Repeated:
- H:0x3 (timeout)
- H:0x1 (no connect)
- Without PDL sense codes
Behavior:
- ESXi retries indefinitely
- Device not permanently removed
PDL Pattern
Detected when:
Sense Key 0x05
ASC 0x25
ASCQ 0x00
Meaning:
- Logical Unit Not Supported
Behavior:
- ESXi stops retrying I/O
- Device marked permanently lost
This automated differentiation directly implements the conceptual framework described in Section 4.
Output Artifacts
This separation facilitates both executive reporting and deep technical investigation.
The following table lists the scripts that produce structured reports:
Example Usage
Example execution:
$ ./scsi_analyzer.sh -f vmkernel.log -v -e
Severity: CRITICAL
Device: naa.60060160f1c01400d2731d49473edd11
Host Status: 0x3 - DID_TIME_OUT
Device Status: 0x0 - GOOD
Recommendation: Possible APD detected. Check fabric connectivity.
Operational Value
By embedding T10-based interpretation logic directly into automated analysis process:
- Storage teams receive standardized diagnostics
- Virtualization teams gain actionable recommendations
- MTTR is reduced through evidence-driven triage
- Cross-team communication improves through the use of shared terminology
The script demonstrates how theoretical SCSI sense interpretation can be operationalized in real-world VMware environments.
Conclusion
SCSI sense codes provide precise, standardized insight into storage failures that cannot be derived from high-level symptoms alone. Administrators who can accurately interpret these codes transition from reactive troubleshooting to a more evidence-based diagnostic methodology. Mastery of SCSI sense data in VMware vSphere environments contributes to faster incident resolution, reduced downtime, and more effective collaboration across infrastructure teams.
Key Takeaways:
- Always examine all three status fields (Host, Device, Plugin) to understand the complete picture.
- Device Status 0x2 (CHECK CONDITION) requires detailed sense data analysis.
- Distinguish between APD and PDL conditions through proper sense code interpretation.
- Correlate errors across multiple hosts to identify storage-level versus host-level issues.
- Combine manual analysis with automated tools and vendor documentation.
- Understand the operational context (VAAI, thin provisioning, queue depth) that influences error occurrence.
References
For more information, see these resources:
- Broadcom Knowledge Base, Article 337796
https://knowledge.broadcom.com/external/article/337796/interpreting-scsi-sense-codes-in-vmware.html - Broadcom Knowledge Base, Article 318712
https://knowledge.broadcom.com/external/article/318712 - Broadcom Knowledge Base, Article 338435 - Understanding SCSI Target NMP Errors and Conditions in ESXi
https://knowledge.broadcom.com/external/article/338435/understanding-scsi-target-nmp-errors-and.html - Broadcom Knowledge Base, Article 1029039 - Understanding SCSI host-side NMP errors/conditions in VMware ESXi
https://knowledge.broadcom.com/external/article?legacyId=1029039 - Broadcom Knowledge Base, Article 1008113 - Controlling LUN queue depth throttling in VMware ESXi
https://knowledge.broadcom.com/external/article?legacyId=1008113 - Broadcom Knowledge Base, Article 1021976 – FAQ for vStorage APIs for Array Integration
https://knowledge.broadcom.com/external/article?legacyId=1021976 - T10 Technical Committee, SCSI Primary Commands (SPC-4 / SPC-5)
- T10 SCSI Sense Keys:
http://www.t10.org/lists/2sensekey.htm - T10 ASC/ASCQ Codes:
http://www.t10.org/lists/asc-num.txt - T10 Operation Codes:
https://www.t10.org/lists/op-num.htm - VMware vSphere 8.0 Storage Administration Guide :
https://techdocs.broadcom.com/us/en/vmware-cis/vsphere/vsphere/8-0/vsphere-storage.html
Appendix: scsi_analyzer.sh script
#!/bin/bash

################################################################################
# SCSI Sense Code Analyzer for VMware ESXi vmkernel.log
# Version: 1.0
# Description: Analyzes SCSI errors and sense codes in vmkernel.log files
#              following VMware KB 338435, 337796, and 318712
################################################################################

# Color codes for output
RED='\033[0;31m'
YELLOW='\033[1;33m'
GREEN='\033[0;32m'
BLUE='\033[0;34m'
CYAN='\033[0;36m'
NC='\033[0m' # No Color
BOLD='\033[1m'

# Default values
LOGFILE=""
OUTPUT_DIR="./scsi_analysis_$(date +%Y%m%d_%H%M%S)"
VERBOSE=0
SHOW_EXAMPLES=0

################################################################################
# Usage information
################################################################################
usage() {
    cat << EOF
${BOLD}SCSI Sense Code Analyzer for VMware ESXi${NC}

Usage: $0 -f  [OPTIONS]

${BOLD}Required:${NC}
  -f FILE         Path to vmkernel.log file

${BOLD}Options:${NC}
  -o DIR          Output directory (default: ./scsi_analysis_TIMESTAMP)
  -v              Verbose mode (show all SCSI errors)
  -e              Show example log entries for each error type
  -h              Display this help message

${BOLD}Examples:${NC}
  $0 -f /var/log/vmkernel.log
  $0 -f vmkernel.log -o /tmp/analysis -v
  $0 -f vmkernel.log.gz -e

${BOLD}Supported Input:${NC}
  - Plain text vmkernel.log files
  - Gzipped vmkernel.log.gz files

EOF
    exit 1
}

################################################################################
# Host Status decoder
################################################################################
decode_host_status() {
    local h_status=$1
    case "$h_status" in
        "0x0")
            echo "DID_OK - Command successfully delivered"
            ;;
        "0x1")
            echo "DID_NO_CONNECT - Unable to establish connectivity"
            ;;
        "0x2")
            echo "DID_BUS_BUSY - SCSI bus busy"
            ;;
        "0x3")
            echo "DID_TIME_OUT - Command timeout"
            ;;
        "0x4")
            echo "DID_BAD_TARGET - Bad target"
            ;;
        "0x5")
            echo "DID_ABORT - Command aborted"
            ;;
        "0x6")
            echo "DID_PARITY - Parity error"
            ;;
        "0x7")
            echo "DID_ERROR - Generic HBA/driver error"
            ;;
        "0x8")
            echo "DID_RESET - SCSI bus reset"
            ;;
        "0x9")
            echo "DID_BAD_INTR - Bad interrupt"
            ;;
        *)
            echo "UNKNOWN - Vendor specific or undefined"
            ;;
    esac
}

################################################################################
# Device Status decoder
################################################################################
decode_device_status() {
    local d_status=$1
    case "$d_status" in
        "0x0")
            echo "GOOD - No device error"
            ;;
        "0x2")
            echo "CHECK_CONDITION - Error with sense data available"
            ;;
        "0x4")
            echo "CONDITION_MET - Conditional command succeeded"
            ;;
        "0x8")
            echo "BUSY - Device temporarily unable to process"
            ;;
        "0x10")
            echo "INTERMEDIATE - Linked command (obsolete)"
            ;;
        "0x14")
            echo "INTERMEDIATE_CONDITION_MET - Combined status (obsolete)"
            ;;
        "0x18")
            echo "RESERVATION_CONFLICT - LUN reserved by another initiator"
            ;;
        "0x22")
            echo "COMMAND_TERMINATED - Command terminated (obsolete)"
            ;;
        "0x28")
            echo "TASK_SET_FULL/QUEUE_FULL - Array queue depth exceeded"
            ;;
        "0x30")
            echo "ACA_ACTIVE - Auto Contingent Allegiance active"
            ;;
        "0x40")
            echo "TASK_ABORTED - Task aborted by another initiator"
            ;;
        *)
            echo "UNKNOWN - Vendor specific ($d_status)"
            ;;
    esac
}

################################################################################
# Sense Key decoder
################################################################################
decode_sense_key() {
    local sk=$1
    case "$sk" in
        "0x0")
            echo "NO_SENSE - No error"
            ;;
        "0x1")
            echo "RECOVERED_ERROR - Recovered error"
            ;;
        "0x2")
            echo "NOT_READY - Logical unit not ready"
            ;;
        "0x3")
            echo "MEDIUM_ERROR - Unrecoverable media error"
            ;;
        "0x4")
            echo "HARDWARE_ERROR - Hardware error"
            ;;
        "0x5")
            echo "ILLEGAL_REQUEST - Invalid command or parameter"
            ;;
        "0x6")
            echo "UNIT_ATTENTION - Device state changed"
            ;;
        "0x7")
            echo "DATA_PROTECT - Write protected or space issue"
            ;;
        "0x8")
            echo "BLANK_CHECK - Blank media encountered"
            ;;
        "0x9")
            echo "VENDOR_SPECIFIC - Vendor specific"
            ;;
        "0xa")
            echo "COPY_ABORTED - Copy command aborted"
            ;;
        "0xb")
            echo "ABORTED_COMMAND - Command aborted"
            ;;
        "0xd")
            echo "VOLUME_OVERFLOW - Volume overflow"
            ;;
        "0xe")
            echo "MISCOMPARE - Source and medium data differ"
            ;;
        *)
            echo "UNKNOWN"
            ;;
    esac
}

################################################################################
# ASC/ASCQ decoder (common codes)
################################################################################
decode_asc_ascq() {
    local sk=$1
    local asc=$2
    local ascq=$3

    local key="${asc}/${ascq}"

    case "$key" in
        "0x4/0x3")
            echo "LOGICAL UNIT NOT READY - MANUAL INTERVENTION REQUIRED"
            ;;
        "0x20/0x0")
            echo "INVALID COMMAND OPERATION CODE"
            ;;
        "0x25/0x0")
            echo "LOGICAL UNIT NOT SUPPORTED"
            ;;
        "0x27/0x7")
            echo "WRITE PROTECTED / SPACE ALLOCATION FAILED"
            ;;
        "0x2a/0x1")
            echo "MODE PARAMETERS CHANGED"
            ;;
        "0x29/0x0")
            echo "POWER ON, RESET, OR BUS DEVICE RESET OCCURRED"
            ;;
        "0x3f/0x0e")
            echo "REPORTED LUNS DATA HAS CHANGED"
            ;;
        "0x3f/0x3")
            echo "INQUIRY DATA HAS CHANGED"
            ;;
        *)
            echo "See T10 ASC-NUM.TXT for details"
            ;;
    esac
}

################################################################################
# Analyze error severity and provide recommendations
################################################################################
analyze_error_severity() {
    local h_status=$1
    local d_status=$2
    local sk=$3
    local asc=$4
    local ascq=$5

    local severity="INFO"
    local recommendation=""

    # Critical APD/PDL conditions
    if [[ "$asc" == "0x25" && "$ascq" == "0x0" ]]; then
        severity="CRITICAL"
        recommendation="PDL (Permanent Device Loss) detected. LUN has been permanently removed or failed."
    elif [[ "$h_status" == "0x3" || "$h_status" == "0x1" ]] && [[ "$d_status" == "0x0" ]]; then
        severity="CRITICAL"
        recommendation="Possible APD (All Paths Down). Check fabric connectivity and storage array."
    # High severity conditions
    elif [[ "$sk" == "0x3" ]]; then
        severity="HIGH"
        recommendation="MEDIUM ERROR - Physical media failure. Check array logs and consider replacing failed disks."
    elif [[ "$d_status" == "0x28" ]]; then
        severity="HIGH"
        recommendation="QUEUE FULL - Array overloaded. Review queue depth settings and I/O load."
    elif [[ "$asc" == "0x27" ]]; then
        severity="HIGH"
        recommendation="DATA PROTECT - Thin provisioned datastore may be out of space. Check capacity immediately."
    # Medium severity conditions
    elif [[ "$d_status" == "0x18" ]]; then
        severity="MEDIUM"
        recommendation="RESERVATION CONFLICT - Check for SCSI-2 reservations or clustering issues."
    elif [[ "$d_status" == "0x8" ]]; then
        severity="MEDIUM"
        recommendation="DEVICE BUSY - Temporary condition. Monitor for persistence."
    elif [[ "$asc" == "0x20" ]]; then
        severity="MEDIUM"
        recommendation="INVALID COMMAND - Possible VAAI incompatibility. Check array VAAI support."
    # Low severity / informational
    elif [[ "$sk" == "0x6" ]]; then
        severity="LOW"
        recommendation="UNIT ATTENTION - Device state change (controller failover, reset). Usually informational."
    fi

    echo "${severity}|${recommendation}"
}

################################################################################
# Extract and analyze SCSI errors
################################################################################
analyze_scsi_errors() {
    local logfile=$1
    local output_file="${OUTPUT_DIR}/scsi_errors_summary.txt"
    local detail_file="${OUTPUT_DIR}/scsi_errors_detailed.txt"
    local critical_file="${OUTPUT_DIR}/critical_errors.txt"

    echo -e "${BLUE}${BOLD}Analyzing SCSI errors...${NC}"

    # Determine how to read the file (gzipped or plain)
    local cat_cmd="cat"
    if [[ "$logfile" == *.gz ]]; then
        cat_cmd="zcat"
    fi

    # Extract SCSI error lines
    local error_pattern="H:0x[0-9a-fA-F]+ D:0x[0-9a-fA-F]+ P:0x[0-9a-fA-F]+"

    $cat_cmd "$logfile" | grep -E "$error_pattern" > "${OUTPUT_DIR}/raw_scsi_errors.tmp"

    local total_errors=$(wc -l < "${OUTPUT_DIR}/raw_scsi_errors.tmp")

    echo -e "${GREEN}Found $total_errors SCSI error entries${NC}"

    # Initialize output files
    cat > "$output_file" << EOF
================================================================================
SCSI Error Analysis Summary
Generated: $(date)
Log file: $logfile
Total SCSI errors found: $total_errors
================================================================================

EOF

    cat > "$detail_file" << EOF
================================================================================
Detailed SCSI Error Analysis
Generated: $(date)
================================================================================

EOF

    cat > "$critical_file" << EOF
================================================================================
CRITICAL SCSI Errors Requiring Immediate Attention
Generated: $(date)
================================================================================

EOF

    # Counters for different error types
    declare -A host_status_count
    declare -A device_status_count
    declare -A sense_key_count
    declare -A asc_ascq_count
    declare -A device_count
    declare -A path_count
    declare -A severity_count

    local critical_count=0
    local high_count=0
    local medium_count=0
    local low_count=0

    # Process each error line
    while IFS= read -r line; do
        # Extract H:, D:, P: values
        h_status=$(echo "$line" | grep -oP 'H:0x[0-9a-fA-F]+' | cut -d: -f2)
        d_status=$(echo "$line" | grep -oP 'D:0x[0-9a-fA-F]+' | cut -d: -f2)
        p_status=$(echo "$line" | grep -oP 'P:0x[0-9a-fA-F]+' | cut -d: -f2)

        # Extract sense data if present
        sense_data=$(echo "$line" | grep -oP '(Valid|Possible) sense data: 0x[0-9a-fA-F]+ 0x[0-9a-fA-F]+ 0x[0-9a-fA-F]+')
        sk=""
        asc=""
        ascq=""

        if [[ -n "$sense_data" ]]; then
            sk=$(echo "$sense_data" | awk '{print $4}')
            asc=$(echo "$sense_data" | awk '{print $5}')
            ascq=$(echo "$sense_data" | awk '{print $6}')
        fi

        # Extract device name
        device=$(echo "$line" | grep -oP '(naa\.[0-9a-f]+|mpx\.[0-9a-f]+|t10\.[^ ]+|sym\.[0-9a-f]+)' | head -1)

        # Extract path
        path=$(echo "$line" | grep -oP 'vmhba[0-9]+:C[0-9]+:T[0-9]+:L[0-9]+')

        # Extract timestamp
        timestamp=$(echo "$line" | awk '{print $1}')

        # Count occurrences
        host_status_count[$h_status]=$((${host_status_count[$h_status]:-0} + 1))
        device_status_count[$d_status]=$((${device_status_count[$d_status]:-0} + 1))

        if [[ -n "$sk" ]]; then
            sense_key_count[$sk]=$((${sense_key_count[$sk]:-0} + 1))
            asc_ascq_count["${asc}/${ascq}"]=$((${asc_ascq_count["${asc}/${ascq}"]:-0} + 1))
        fi

        if [[ -n "$device" ]]; then
            device_count[$device]=$((${device_count[$device]:-0} + 1))
        fi

        if [[ -n "$path" ]]; then
            path_count[$path]=$((${path_count[$path]:-0} + 1))
        fi

        # Analyze severity
        severity_info=$(analyze_error_severity "$h_status" "$d_status" "$sk" "$asc" "$ascq")
        severity=$(echo "$severity_info" | cut -d'|' -f1)
        recommendation=$(echo "$severity_info" | cut -d'|' -f2)

        severity_count[$severity]=$((${severity_count[$severity]:-0} + 1))

        # Write detailed analysis
        if [[ $VERBOSE -eq 1 ]] || [[ "$severity" == "CRITICAL" ]] || [[ "$severity" == "HIGH" ]]; then
            cat >> "$detail_file" << EOF
--------------------------------------------------------------------------------
Timestamp: $timestamp
Device: ${device:-N/A}
Path: ${path:-N/A}
Host Status: $h_status - $(decode_host_status "$h_status")
Device Status: $d_status - $(decode_device_status "$d_status")
Plugin Status: $p_status
EOF

            if [[ -n "$sk" ]]; then
                cat >> "$detail_file" << EOF
Sense Key: $sk - $(decode_sense_key "$sk")
ASC/ASCQ: ${asc}/${ascq} - $(decode_asc_ascq "$sk" "$asc" "$ascq")
EOF
            fi

            cat >> "$detail_file" << EOF
Severity: $severity
Recommendation: $recommendation

EOF

            if [[ $SHOW_EXAMPLES -eq 1 ]]; then
                echo "Original log entry:" >> "$detail_file"
                echo "$line" >> "$detail_file"
                echo "" >> "$detail_file"
            fi
        fi

        # Write critical errors to separate file
        if [[ "$severity" == "CRITICAL" ]]; then
            cat >> "$critical_file" << EOF
[$timestamp] Device: ${device:-N/A} | Path: ${path:-N/A}
H:$h_status D:$d_status P:$p_status | SK:$sk ASC/ASCQ:${asc}/${ascq}
$(decode_device_status "$d_status")
RECOMMENDATION: $recommendation
$line

EOF
            ((critical_count++))
        elif [[ "$severity" == "HIGH" ]]; then
            ((high_count++))
        elif [[ "$severity" == "MEDIUM" ]]; then
            ((medium_count++))
        else
            ((low_count++))
        fi

    done < "${OUTPUT_DIR}/raw_scsi_errors.tmp"

    # Generate summary report
    cat >> "$output_file" << EOF

================================================================================
SEVERITY BREAKDOWN
================================================================================
CRITICAL errors: $critical_count (Immediate action required)
HIGH severity:   $high_count (Investigate soon)
MEDIUM severity: $medium_count (Monitor)
LOW/INFO:        $low_count (Informational)

EOF

    # Host Status summary
    cat >> "$output_file" << EOF
================================================================================
HOST STATUS SUMMARY
================================================================================
EOF
    for h_status in "${!host_status_count[@]}"; do
        printf "%-10s: %5d - %s\n" "$h_status" "${host_status_count[$h_status]}" "$(decode_host_status "$h_status")" >> "$output_file"
    done | sort >> "$output_file"

    # Device Status summary
    cat >> "$output_file" << EOF

================================================================================
DEVICE STATUS SUMMARY
================================================================================
EOF
    for d_status in "${!device_status_count[@]}"; do
        printf "%-10s: %5d - %s\n" "$d_status" "${device_status_count[$d_status]}" "$(decode_device_status "$d_status")" >> "$output_file"
    done | sort >> "$output_file"

    # Sense Key summary (if any)
    if [[ ${#sense_key_count[@]} -gt 0 ]]; then
        cat >> "$output_file" << EOF

================================================================================
SENSE KEY SUMMARY
================================================================================
EOF
        for sk in "${!sense_key_count[@]}"; do
            printf "%-10s: %5d - %s\n" "$sk" "${sense_key_count[$sk]}" "$(decode_sense_key "$sk")" >> "$output_file"
        done | sort >> "$output_file"
    fi

    # ASC/ASCQ summary (if any)
    if [[ ${#asc_ascq_count[@]} -gt 0 ]]; then
        cat >> "$output_file" << EOF

================================================================================
ASC/ASCQ SUMMARY (Top 10)
================================================================================
EOF
        for asc_ascq in "${!asc_ascq_count[@]}"; do
            printf "%-15s: %5d\n" "$asc_ascq" "${asc_ascq_count[$asc_ascq]}"
        done | sort -t: -k2 -rn | head -10 >> "$output_file"
    fi

    # Device summary (if any)
    if [[ ${#device_count[@]} -gt 0 ]]; then
        cat >> "$output_file" << EOF

================================================================================
AFFECTED DEVICES (Top 10)
================================================================================
EOF
        for device in "${!device_count[@]}"; do
            printf "%-50s: %5d errors\n" "$device" "${device_count[$device]}"
        done | sort -t: -k2 -rn | head -10 >> "$output_file"
    fi

    # Path summary (if any)
    if [[ ${#path_count[@]} -gt 0 ]]; then
        cat >> "$output_file" << EOF

================================================================================
AFFECTED PATHS (Top 10)
================================================================================
EOF
        for path in "${!path_count[@]}"; do
            printf "%-30s: %5d errors\n" "$path" "${path_count[$path]}"
        done | sort -t: -k2 -rn | head -10 >> "$output_file"
    fi

    # Add recommendations section
    cat >> "$output_file" << EOF

================================================================================
RECOMMENDED ACTIONS
================================================================================
EOF

    if [[ $critical_count -gt 0 ]]; then
        cat >> "$output_file" << EOF

${critical_count} CRITICAL errors detected! Review ${critical_file}

Common critical conditions:
  - APD (All Paths Down): Restore fabric/storage connectivity immediately
  - PDL (Permanent Device Loss): Follow LUN removal cleanup procedures
  - MEDIUM ERROR: Check array for failed disks

EOF
    fi

    if [[ $high_count -gt 0 ]]; then
        cat >> "$output_file" << EOF

${high_count} HIGH severity errors detected!

Common high-severity conditions:
  - QUEUE FULL: Review LUN queue depth and I/O load
  - DATA PROTECT: Check thin-provisioned datastore capacity
  - Physical media errors: Examine array health status

EOF
    fi

    cat >> "$output_file" << EOF

General recommendations:
  1. Correlate errors across multiple hosts (shared storage issue vs. host issue)
  2. Check VMware compatibility guides for array firmware versions
  3. Review array logs for corresponding events
  4. Verify HBA firmware and driver versions
  5. Check SAN fabric for errors, congestion, or misconfigurations

References:
  - VMware KB 338435: Understanding SCSI Target NMP Errors
  - VMware KB 337796: SCSI Sense Code Decoder
  - VMware KB 1029039: SCSI Host-Side NMP Errors
  - T10.org: http://www.t10.org/lists/asc-num.txt

EOF

    echo -e "${GREEN}Analysis complete!${NC}"
    echo -e "${CYAN}Summary report: ${output_file}${NC}"
    echo -e "${CYAN}Detailed analysis: ${detail_file}${NC}"

    if [[ $critical_count -gt 0 ]]; then
        echo -e "${RED}${BOLD}Critical errors: ${critical_file}${NC}"
    fi

    # Clean up temp file
    rm -f "${OUTPUT_DIR}/raw_scsi_errors.tmp"
}

################################################################################
# APD/PDL specific analysis
################################################################################
analyze_apd_pdl() {
    local logfile=$1
    local output_file="${OUTPUT_DIR}/apd_pdl_analysis.txt"

    echo -e "${BLUE}${BOLD}Analyzing APD/PDL conditions...${NC}"

    local cat_cmd="cat"
    if [[ "$logfile" == *.gz ]]; then
        cat_cmd="zcat"
    fi

    cat > "$output_file" << EOF
================================================================================
APD (All Paths Down) and PDL (Permanent Device Loss) Analysis
Generated: $(date)
================================================================================

EOF

    # Look for APD indicators
    echo "Searching for APD indicators..." >> "$output_file"
    echo "" >> "$output_file"

    local apd_count=$($cat_cmd "$logfile" | grep -i "all paths down\|APD\|Device.*Dead.*Dead" | wc -l)

    if [[ $apd_count -gt 0 ]]; then
        echo "Found $apd_count potential APD-related log entries" >> "$output_file"
        echo "" >> "$output_file"
        $cat_cmd "$logfile" | grep -i "all paths down\|APD" | head -20 >> "$output_file"
    else
        echo "No explicit APD conditions found" >> "$output_file"
    fi

    echo "" >> "$output_file"
    echo "Searching for PDL indicators..." >> "$output_file"
    echo "" >> "$output_file"

    # Look for PDL indicators (ASC 0x25 ASCQ 0x0)
    local pdl_count=$($cat_cmd "$logfile" | grep -E "0x25 0x0|Permanent Device Loss|PDL|LOGICAL UNIT NOT SUPPORTED" | wc -l)

    if [[ $pdl_count -gt 0 ]]; then
        echo "Found $pdl_count potential PDL-related log entries" >> "$output_file"
        echo "" >> "$output_file"
        $cat_cmd "$logfile" | grep -E "0x25 0x0|Permanent Device Loss|PDL" | head -20 >> "$output_file"
    else
        echo "No explicit PDL conditions found" >> "$output_file"
    fi

    echo "" >> "$output_file"
    echo "Note: APD conditions show path timeouts/failures without PDL sense codes." >> "$output_file"
    echo "      PDL conditions show ASC 0x25 / ASCQ 0x0 (Logical Unit Not Supported)." >> "$output_file"

    echo -e "${GREEN}APD/PDL analysis saved to: ${output_file}${NC}"
}

################################################################################
# Generate timeline of errors
################################################################################
generate_timeline() {
    local logfile=$1
    local output_file="${OUTPUT_DIR}/error_timeline.txt"

    echo -e "${BLUE}${BOLD}Generating error timeline...${NC}"

    local cat_cmd="cat"
    if [[ "$logfile" == *.gz ]]; then
        cat_cmd="zcat"
    fi

    cat > "$output_file" << EOF
================================================================================
SCSI Error Timeline
Generated: $(date)
================================================================================

EOF

    # Extract errors with timestamps and sort
    $cat_cmd "$logfile" | grep -E "H:0x[0-9a-fA-F]+ D:0x[0-9a-fA-F]+" | \
        awk '{print $1, $0}' | sort | \
        awk '{$1=""; print}' | head -100 >> "$output_file"

    echo "" >> "$output_file"
    echo "Showing first 100 SCSI errors in chronological order" >> "$output_file"

    echo -e "${GREEN}Timeline saved to: ${output_file}${NC}"
}

################################################################################
# Main execution
################################################################################
main() {
    # Create output directory
    mkdir -p "$OUTPUT_DIR"

    echo -e "${BOLD}${BLUE}"
    echo "================================================================================"
    echo "  SCSI Sense Code Analyzer for VMware ESXi"
    echo "  Version 1.0"
    echo "================================================================================"
    echo -e "${NC}"

    echo -e "${CYAN}Log file: ${LOGFILE}${NC}"
    echo -e "${CYAN}Output directory: ${OUTPUT_DIR}${NC}"
    echo ""

    # Verify log file exists and is readable
    if [[ ! -f "$LOGFILE" ]]; then
        echo -e "${RED}Error: Log file not found: $LOGFILE${NC}"
        exit 1
    fi

    if [[ ! -r "$LOGFILE" ]]; then
        echo -e "${RED}Error: Cannot read log file: $LOGFILE${NC}"
        exit 1
    fi

    # Run analyses
    analyze_scsi_errors "$LOGFILE"
    analyze_apd_pdl "$LOGFILE"
    generate_timeline "$LOGFILE"

    echo ""
    echo -e "${BOLD}${GREEN}================================================================================"
    echo "  Analysis Complete!"
    echo "================================================================================${NC}"
    echo ""
    echo -e "${CYAN}Results saved in: ${OUTPUT_DIR}/${NC}"
    echo ""
    echo "Files generated:"
    echo "  - scsi_errors_summary.txt    : Overview and statistics"
    echo "  - scsi_errors_detailed.txt   : Detailed error analysis"
    echo "  - critical_errors.txt        : Critical errors requiring immediate attention"
    echo "  - apd_pdl_analysis.txt       : APD/PDL condition analysis"
    echo "  - error_timeline.txt         : Chronological error timeline"
    echo ""

    # Check if critical errors were found
    if [[ -s "${OUTPUT_DIR}/critical_errors.txt" ]]; then
        local crit_lines=$(wc -l < "${OUTPUT_DIR}/critical_errors.txt")
        if [[ $crit_lines -gt 10 ]]; then
            echo -e "${RED}${BOLD}⚠ WARNING: Critical errors detected! Review critical_errors.txt immediately${NC}"
            echo ""
        fi
    fi
}

################################################################################
# Parse command line arguments
################################################################################
while getopts "f:o:veh" opt; do
    case $opt in
        f)
            LOGFILE="$OPTARG"
            ;;
        o)
            OUTPUT_DIR="$OPTARG"
            ;;
        v)
            VERBOSE=1
            ;;
        e)
            SHOW_EXAMPLES=1
            ;;
        h)
            usage
            ;;
        \?)
            echo -e "${RED}Invalid option: -$OPTARG${NC}" >&2
            usage
            ;;
    esac
done

# Check if log file was specified
if [[ -z "$LOGFILE" ]]; then
    echo -e "${RED}Error: Log file not specified${NC}"
    echo ""
    usage
fi

# Run main function
main

exit 0
Author
David Hsia is an OS Engineer in the Lenovo Infrastructure Solutions Group, based in Taipei, Taiwan. As a specialist in Linux and VMware technical support, he is interested in operating system and focuses on VMware vSphere and ESXi.
Thanks to the following specialists for their contributions and suggestions:
- Gary Cudak, Lenovo Principal OS Engineer
- Alpus Chen, Lenovo OS Engineer
- David Watts, Lenovo Press
Trademarks
Lenovo and the Lenovo logo are trademarks or registered trademarks of Lenovo in the United States, other countries, or both. A current list of Lenovo trademarks is available on the Web at https://www.lenovo.com/us/en/legal/copytrade/.
The following terms are trademarks of Lenovo in the United States, other countries, or both:
Lenovo®
Other company, product, or service names may be trademarks or service marks of others.
Configure and Buy
Please select a locale
Full Change History
Course Detail
Employees Only Content
The content in this document with a is only visible to employees who are logged in. Logon using your Lenovo ITcode and password via Lenovo single-signon (SSO).
The author of the document has determined that this content is classified as Lenovo Internal and should not be normally be made available to people who are not employees or contractors. This includes partners, customers, and competitors. The reasons may vary and you should reach out to the authors of the document for clarification, if needed. Be cautious about sharing this content with others as it may contain sensitive information.
Any visitor to the Lenovo Press web site who is not logged on will not be able to see this employee-only content. This content is excluded from search engine indexes and will not appear in any search results.
For all users, including logged-in employees, this employee-only content does not appear in the PDF version of this document.
This functionality is cookie based. The web site will normally remember your login state between browser sessions, however, if you clear cookies at the end of a session or work in an Incognito/Private browser window, then you will need to log in each time.
If you have any questions about this feature of the Lenovo Press web, please email David Watts at dwatts@lenovo.com.


