

Top
Author
Published
14 Nov 2026Form Number
LP2571PDF size
14 pages, 500 KBSubscribed to LP2571.
Thank you for your feedback.
Table of Contents
Abstract
As enterprise AI expands into sustained inference and multi-step agentic workflows, infrastructure decisions increasingly depend on token economics, operational control, and data sovereignty.
This paper compares the five-year total cost of ownership of 32-GPU and 128-GPU Lenovo ThinkSystem deployments hosted at Digital Realty against a modeled AWS GPU rental benchmark. It quantifies cost savings, breakeven, rental-hour tipping points, and modeled inference costs while examining a Lenovo Hybrid AI Advantage strategy that owns capacity for sustained demand and extends it through Lenovo partnerships and TruScale for demand spikes.
Digital Realty contributed to the colocation model, deployment assumptions, and connectivity scenario used in this analysis.
Executive Summary
When AI becomes an everyday service, leaders need to know what it will cost to run and who controls the data behind it. Customer-owned Lenovo infrastructure deployed in a colocation environment with Digital Realty gives enterprises a way to grow AI on terms they can manage: predictable capacity spending, freedom to choose and operate their models, and control over where sensitive workloads run.
The financial opportunity is substantial. Over five years of continuous operation, the medium Full System costs $4.14 million versus $6.39 million for AWS rental, saving $2.24 million (35.1%). The large Full System costs $26.75 million versus $106.03 million, saving $79.28 million (74.8%). That headroom can fund new AI applications and wider adoption while the enterprise retains ownership of its infrastructure.
These savings reflect the modeled cloud benchmark rather than every available cloud offer. Commitment discounts narrow the advantage, particularly for the medium configuration, while software coverage and site-specific deployment requirements also affect the final ownership cost. The comparison is most useful as a framework for matching sustained demand to an appropriate mix of owned and rented capacity.
These totals include the usual selling price, 10% annual maintenance and upkeep, and colocation. Savings with optional connectivity remained 33.4% and 74.5%. Full System breakeven occurs after 28.7 and 8.8 months. Extending Lenovo TCO research [1], this paper shows how ownership can combine lower costs with control over model deployment and support for data sovereignty. Lenovo Hybrid AI Advantage brings this ownership strategy together with Lenovo partnerships and TruScale options for burst capacity.
Digital Realty complements Lenovo’s compute infrastructure with the colocation and connectivity foundation for private AI. PlatformDIGITAL® provides access to cloud and partner ecosystems, while ServiceFabric® supports private connections to selected service providers [3]. Digital Realty Innovation Labs (DRIL), with Lenovo among the participating partners, enable enterprises to validate AI and hybrid cloud architectures before scaling [12]. This combination connects infrastructure planning with a practical path from pilot to production.
Enterprise AI and the New Supercomputing Requirement
Production AI combines training, fine-tuning, and inference with different resource demands. Large training jobs coordinate computation across accelerators; inference must meet application throughput and latency requirements. Agentic systems add repeated model calls, retrieval, and tool interactions. For an enterprise operating around the clock, ownership spreads the initial investment over sustained use. Colocation supplies a deployment environment, with Lenovo partnerships and TruScale options supporting temporary or specialized demand.
How LLM and Agentic Workloads Consume Infrastructure
Model weights, runtime data, and the key-value cache compete for GPU memory. Context length, concurrency, precision, batching, and interconnects affect achievable throughput. Sizing therefore includes the serving configuration and supporting systems as well as the accelerators.
Reasoning, growing context, and retries increase the resources consumed by an agentic task. APIs meter billable tokens; customer-owned systems consume installed capacity, and self-hosted cloud instances accrue instance time. Ownership gives the enterprise control over its capacity budget and effective price per token. Token economics connects these infrastructure costs to output production under an explicit workload and throughput assumption.
Private AI with Lenovo and Digital Realty
Lenovo supplies the compute and supporting infrastructure; Digital Realty provides the colocation environment. The medium deployment reserves one 50 kW rack. The large deployment reserves six 50 kW racks, totaling 300 kW: five racks each contain three accelerator nodes, and the sixth contains the remaining accelerator node and supporting systems. Both deployments are air-cooled. Digital Realty also offers liquid-cooling options for different thermal requirements [2].
The customer retains control over model selection, software versions, access policies, and workload scheduling. Model weights, prompts, and enterprise context can remain within a selected private environment. Hosting location and workload placement support data residency and sovereignty requirements through the enterprise's governance policies.
ServiceFabric® supplies private connectivity to service providers [3]. Together with fiber cross-connects, it can link the owned AI environment to selected Lenovo partner environments. Within Lenovo Hybrid AI Advantage, the enterprise retains sustained workloads locally and plans additional capacity through Lenovo partnerships and TruScale.
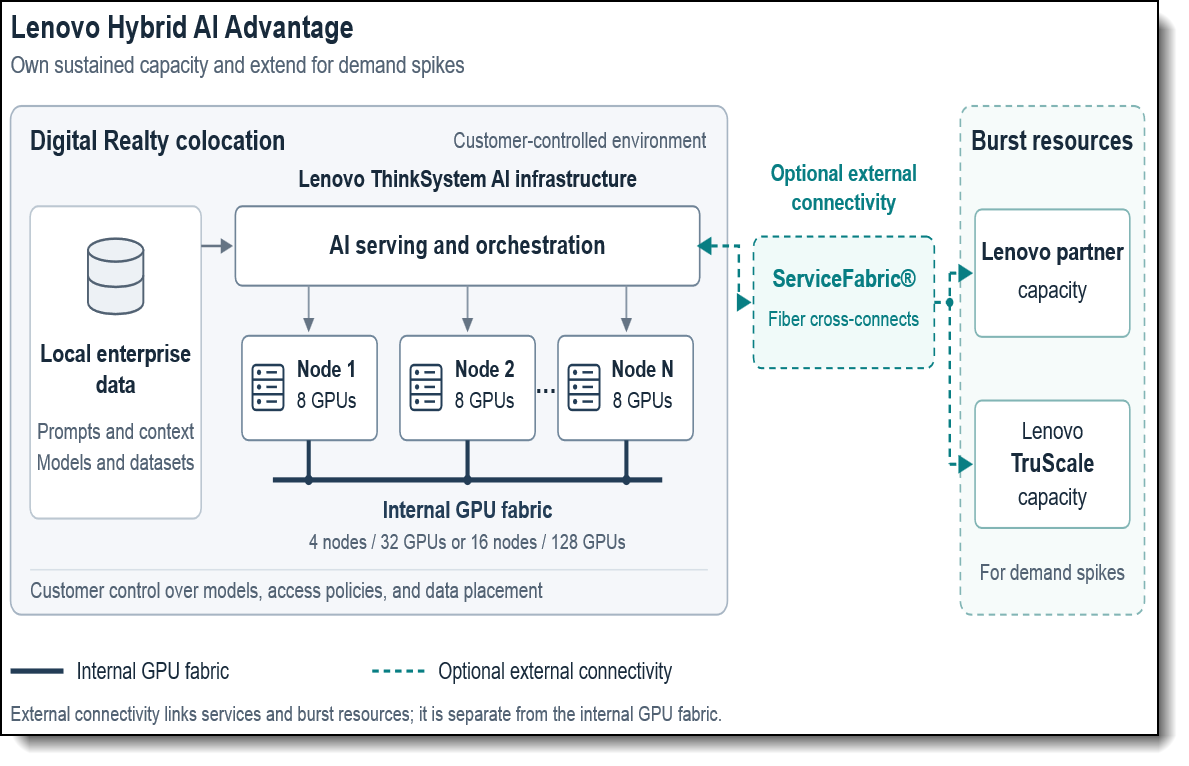
Figure 1. Lenovo Hybrid AI Advantage architecture with customer-controlled Lenovo AI infrastructure inside Digital Realty, local enterprise data, and optional ServiceFabric connectivity to Lenovo partner and TruScale burst resources.
In the following sections, we take a deeper dive:
PlatformDIGITAL: private AI with ecosystem access
PlatformDIGITAL® hosts customer-owned Lenovo infrastructure in a cloud- and carrier-neutral colocation environment. This gives enterprises access to the power, cooling, and rack capacity required by private AI without building or upgrading a corporate data center. The reference configurations use 50 kW air-cooled racks, with liquid-cooling options available for different density requirements [2]. ServiceFabric® and fiber cross-connects link the owned environment to selected cloud, data, application, and partner services [3], connecting private AI to the information and resources it serves.
Digital Realty’s 380 enabled on-ramps across native and partner-enabled connections [14] give enterprises options for connecting private AI to the wider cloud ecosystem. Available destinations, bandwidth, and service terms depend on the selected deployment; the optional connectivity scenario in this paper represents a defined connection package rather than access to every destination. 4.2
Digital Realty Innovation Labs: validate before scaling
Digital Realty Innovation Labs (DRIL) provide real-world data center environments in which enterprises can test and optimize AI and hybrid cloud architectures before production deployment. Customers can bring their own workloads or use pre-configured infrastructure, with Lenovo participating in the partner ecosystem [12]. Testing compute, power, cooling, and connectivity together helps enterprises evaluate how the complete architecture will support their workloads.
The DRIL network includes established locations in Northern Virginia, Tokyo, London, São Paulo, and Singapore, with further expansion planned in Johannesburg in 2027 [13]. Every DRIL supports liquid-cooled racks at cabinet densities of 150 kW and above, providing an environment to evaluate higher-density AI infrastructure [13]. These capabilities extend the range of architectures available for validation; the reference configurations and TCO calculations in this paper remain based on air cooling.
Reference Architectures and Cloud Comparisons
The BOMs also include adapters, optics, cabling, rack power distribution, and management software. Three-year software entries comprise XClarity One for 10 medium and 25 large endpoints, 32 NVIDIA Enterprise per-GPU subscriptions in the medium system, and six NetQ switch subscriptions in the large system. Tables summarize the supplied BOMs [7]; rack allocation follows the agreed six-rack deployment [8].
The software subscription terms in the supplied configuration do not all span the five-year analysis. XClarity One and other listed software entries carry three-year terms [7]. Any renewals needed to maintain equivalent coverage in years four and five would increase ownership cost unless already included in the maintenance allowance. The available inputs do not separately establish those renewal costs, so the results should not be read as confirmation of fully funded five-year software coverage.
The following table lists configurations and comparable cloud GPU capacity.
Financial Framework and Assumptions
The model uses five 365-day years, or H = 43,800 hours, with fixed USD prices and continuous operation. The usual selling prices are C = $2,062,490.28 for medium and $13,630,048.87 for large. Annual maintenance and upkeep are 10% of the usual selling price. Digital Realty's combined colocation rate is $350 per reserved kW per month for all 60 months [8]. Calculations retain full precision, with reported currency rounded to cents.
The colocation model uses the October 2026 proposal [8] as its pricing basis, holding the rate at $350 per reserved kW per month throughout the five-year term. This provides a consistent basis for comparing ownership with cloud rental, rather than a general market price. The results reflect the proposed service scope and assume no price escalation.
The same approach applies to capacity: reserved power represents the allowance for complete deployment, not measured GPU consumption. The model assumes that the selected facility can accommodate the accelerator nodes and supporting systems at the stated air-cooled rack density. Different power or cooling needs could require a different rack layout, while changes in service charges or lease terms would also affect ownership costs and the time to breakeven.
The model applies AWS fleet rates of R = $145.835/hour for medium and $2,420.75136/hour for large, taken from the supplied US West (Oregon) pricing snapshot of October 22, 2026. These are total fleet rates, not per-instance rates, and are held constant without commitment discounts in the base case. They serve as modeling inputs rather than confirmation that both fleets can be purchased as on-demand Dedicated Instances under the same terms. Section 7.5 examines how lower effective cloud prices change the ownership comparison.
Cloud purchasing options are not interchangeable. AWS lists On-Demand, Spot, and Savings Plans for G7e, while its P6-B300 announcement identifies Capacity Blocks and Savings Plans and directs customers to their account manager for on-demand reservations [15–16]. These announcements do not establish the draft’s exact Dedicated Instance tenancy and regional pricing assumptions. The financial results are therefore conditional on the stated benchmark rates; a different available offer would change the comparison. Ownership and cloud remain complementary choices, with the balance determined by workload stability, capacity access, and service requirements.
Let P be reserved power in kW and D be optional monthly connectivity. D = 0 for the Full System scenario. With optional connectivity, medium uses one ServiceFabric® 10G port and four fiber cross-connects, giving D = $1,830/month; large uses two ports and ten cross-connects, giving D = $4,400/month. Annual operating cost A and cumulative costs after y years are:
The optional connectivity package is modeled separately from the base colocation configuration. Its monthly costs reflect the stated port and cross-connect quantities, rather than a generally available price list or an allowance for every cloud destination. Additional connections, destination-specific services, or usage-based charges would need to be included in the cost of the selected architecture.
A = 0.10C + 12 (350P + D)
Tprivate (y) = C + yA
Tcloud (y) = (24 x 365) yR
The purchase is charged at deployment, operating costs accrue evenly, and the model applies no residual-value credit. The Full System five-year calculations are:
Medium: Medium: 2,062,490.28(1 + 5 × 0.10) + 60 × 350 × 50 = $4,143,735.42
Large: 13,630,048.87(1 + 5 × 0.10) + 60 × 350 × 300 = $26,745,073.31
AWS medium: 43,800 × 145.835 = $6,387,573.00
AWS large: 43,800 × 2,420.75136 = $106,028,909.57
Five Year Total Cost of Ownership Analysis
The following topics are covered in this section:
Bundled costs and savings
The Full System saves $2.24 million for medium and $79.28 million for large. Optional connectivity adds $109,800 and $264,000 to the five-year totals, respectively. Both scenarios include the complete configured infrastructure; the optional package adds external connectivity.
Breakeven against continuous cloud rental
Breakeven is the elapsed time at which cumulative ownership and rental costs are equal. With full-time rental, setting C + yA = 8,760Ry gives:
yBE = C /(8,760R - A) and MonthsBE = 12yBE
Using Full System annual operating costs of $416,249.0280 for medium and $2,623,004.8870 for large gives the following results. These costs combine maintenance and upkeep with colocation, with D = 0:
Medium months = (12 × 2,062,490.28)/((8,760 × 145.835) - 416,249.0280) = 28.74
The large system reaches cost parity within its first year. The medium system reaches parity during year three. These timings follow the upfront-purchase and evenly accruing operating-cost convention defined above.
Cumulative costs and savings
Cumulative savings equal AWS rental minus Full System ownership cost. Figure 2 shows how the upfront investment is recovered through avoided rental. Full System cost parity occurs at 28.74 months for medium and 8.80 months for large; five-year savings reach $2.24 million and $79.28 million, respectively.
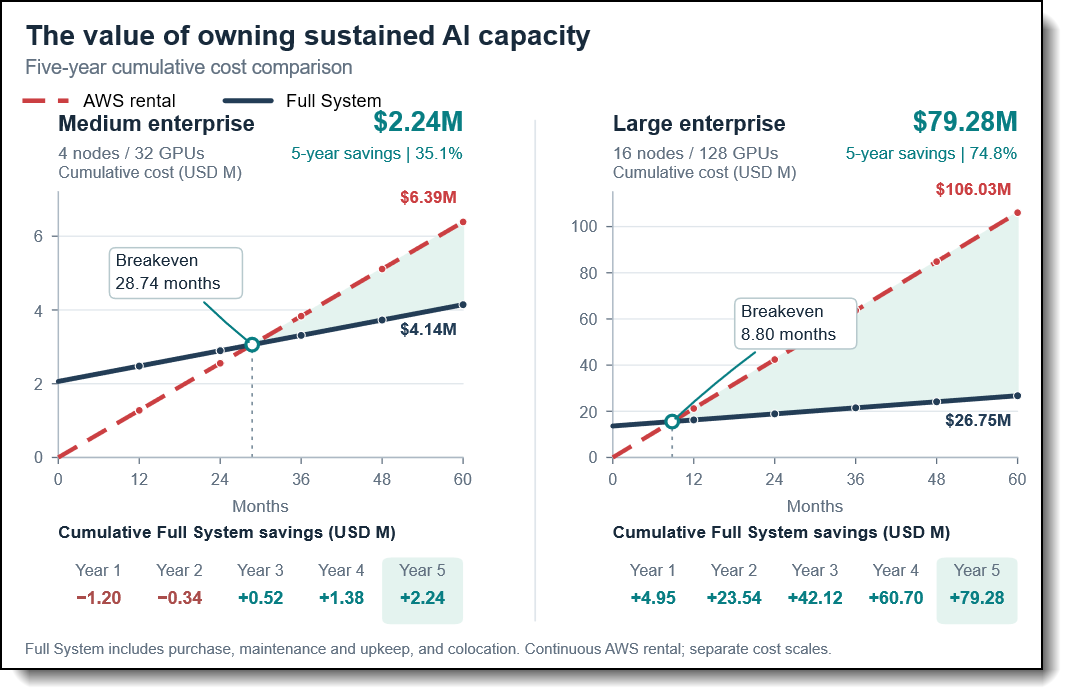
Figure 2. Cumulative costs and savings over months 0 to 60, with separate panels for medium and large.
Rental hour tipping points
A second decision is whether cloud capacity can be released during idle periods. Let u be the fraction of five-year full-fleet rental hours actually purchased. Ownership retains its fixed five-year cost while cloud cost becomes 43,800Ru. Cost parity occurs at:
u* = (C + 5A)/43,800R and Hours/day* = 24u*
Medium months = (12 × 2,062,490.28)/((8,760 × 145.835) - 416,249.0280) = 28.74
The large system reaches cost parity within its first year. The medium system reaches parity during year three. These timings follow the upfront-purchase and evenly accruing operating-cost convention defined aboveThe medium threshold is $4,143,735.42 / $6,387,573.00 = 64.87%. The large threshold is $26,745,073.31 / $106,028,909.57 = 25.22%. Above these rental-hour fractions, Full System ownership is cheaper within the five-year model.
These percentages describe billable rental time for equivalent fleet capacity. GPU activity and productive inference time are separate measures. A cloud fleet kept provisioned continuously accrues its full rental cost even if the GPUs are lightly loaded. The medium configuration benefits most from steady demand; the large configuration reaches parity at a lower rental-hour threshold.
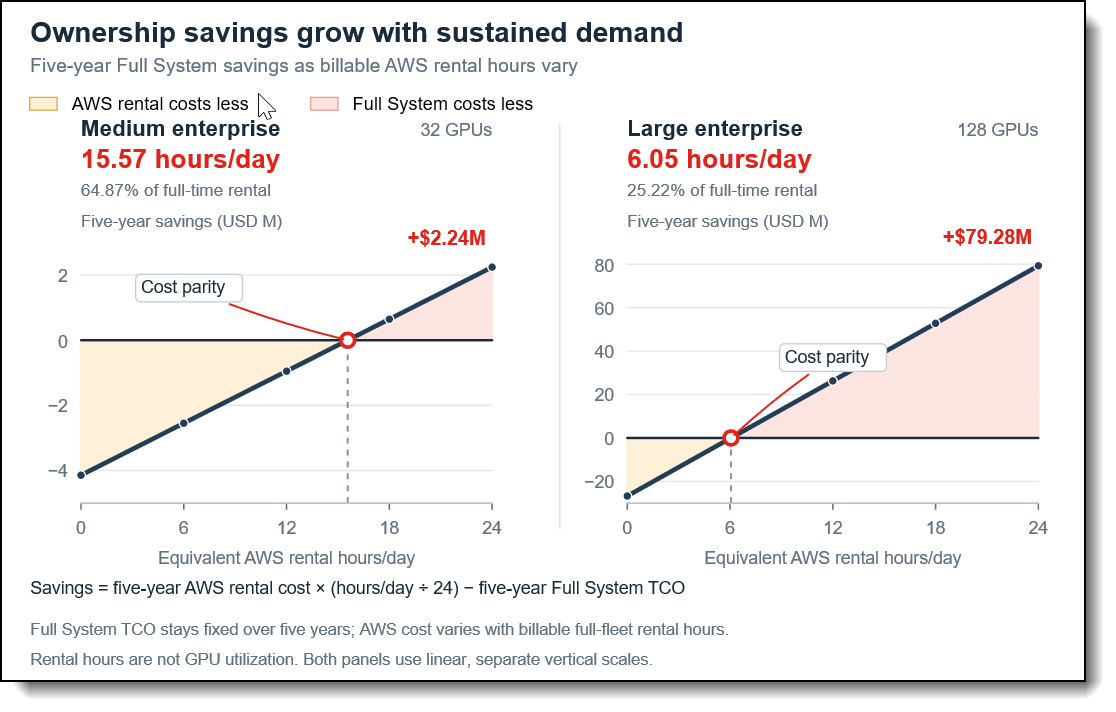
Figure 3. Five-year Full System ownership savings versus equivalent cloud rental hours per day from 0 to 24
Sensitivity to committed cloud pricing
A lower effective cloud price reduces the savings available from ownership. The following scenarios apply illustrative discounts of 0%, 25%, 40%, and 55% to the five-year AWS rental totals in Table 2, holding Full System ownership costs and continuous fleet use unchanged. These are sensitivity assumptions, not quoted discounts or confirmed offers for the listed instances.
Positive values indicate lower ownership cost; negative values indicate lower cloud cost. Savings percentages use the discounted cloud total as the denominator. The medium configuration reaches cost parity at an effective cloud discount of approximately 35.1% and becomes more expensive beyond that point. The large configuration retains an ownership advantage at every discount shown, although its savings also decline as cloud prices fall.
The practical choice is therefore not ownership versus cloud in isolation. Enterprises can use owned capacity for predictable demand and cloud or partner resources where flexibility or access to additional capacity justifies the price. Commitment terms and the ability to release idle capacity should be evaluated alongside the rental-hour thresholds in previous section (Rental hour tipping points).
Token Economics for Representative Models
The study uses author-supplied, MLPerf-based single-node throughput inputs. MLPerf defines workload, scenario, and quality requirements for inference measurements [4]. Fleet throughput is projected using four or sixteen independent serving replicas. Each row below assigns the entire fleet to one model; cloud unit costs assume throughput parity with the corresponding Lenovo configuration.
The following topics are covered in this section:
Cost per million output tokens
Let q be single-node output tokens per second, N the number of accelerator nodes, and Q = Nq the projected fleet throughput. The time t required for one million output tokens and the corresponding ownership cost K are:
t1M = 1,000,000/Q
Kprivate = (Tprivate (5))/43,800 × t1M/3,600
The numerator is the five-year Full System ownership total. For cloud, substitute its five-year total or multiply t by the fleet hourly rate divided by 3,600. Times represent aggregate output production across concurrent requests. Full System amortized fleet rates are $94.6058/hour for medium and $610.6181/hour for large.
Worked example: large GPT-OSS-120B uses Q = 16 x 132,000 = 2,112,000 tokens/s. One million tokens require 0.473485 seconds. The Full System cost is (0.473485 / 3,600) x $610.6181 = $0.0803 per million output tokens; the AWS cost at assumed equal throughput is $0.3184.
These are continuous-inference scenarios at the stated throughput. With the same active throughput but only half the time producing output, the owned cost per million doubles. At a 40% duty cycle the owned cost is 2.5 times the table value: the medium GPT-OSS-120B figure rises to about $1.08 per million output tokens, above the API reference in Table 6, while the large DeepSeek-R1 figure rises to about $0.34, still well below it. Context, precision, concurrency, and latency targets must be matched when applying the results to a production workload. Training performance requires its own time-to-solution analysis.
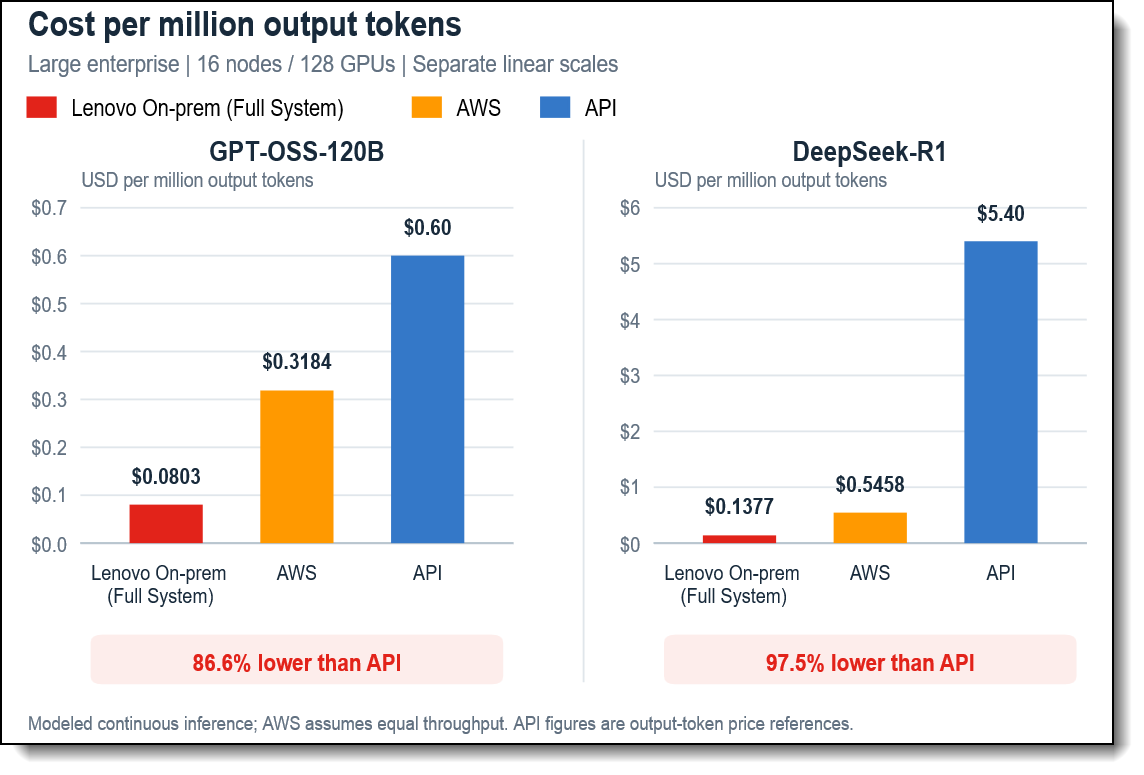
Figure 4. Grouped bars for Full System, AWS, and API cost per million output tokens
API reference and agentic task economics
The output-price references are $0.60 per million tokens for GPT-OSS-120B from Groq [5] and $5.40 for DeepSeek-R1 as reported by OpenCode [9], accessed October 23, 2026. Table 6 compares those references with the modeled Full System output costs. API input billing is separate; production comparisons should match model behavior, workload, and service requirements.
For DeepSeek-R1, the modeled Full System output cost is about $0.14 per million tokens against the $5.40 API reference. That is approximately 97.5% lower, illustrating the financial headroom available when sustained reasoning workloads run on owned capacity. API prices include the provider's margin, redundancy and interactive latency, and the owned figure assumes continuous output, so the two are not like for like.
For agentic applications, record reasoning, retries, and unsuccessful attempts alongside final output. Cost per successful task is allocated trajectory cost divided by successful completions. Token and retry budgets protect the capacity available to users.
Lenovo Hybrid AI Advantage and Burst Capacity
Lenovo Hybrid AI Advantage brings together infrastructure, models, services, and partner integrations [10]. In this architecture, customers own sustained capacity at Digital Realty and arrange additional capacity through Lenovo partnerships and TruScale. Lenovo TruScale GPU as a Service provides metered GPU resources and workload scheduling [11].
The Full System with optional connectivity supports access to selected Lenovo partner environments. Medium uses one ServiceFabric® 10G port and four fiber cross-connects; large uses two ports and ten cross-connects. ServiceFabric® supplies private connections to service providers [3]. The internal GPU fabric serves local accelerator communication, while external connections link applications, data services, and burst resources.
Prepare model artifacts, data access, scheduling, and the agreed capacity service before a spike. The Full System with optional connectivity scenario covers the complete owned system with external connectivity provisioned; additional burst capacity follows the selected Lenovo partner or TruScale service arrangement.
Deployment Considerations and Conclusion
When AI supports everyday business, predictable infrastructure spending gives teams confidence to expand its use. The modeled Full System savings of $2.24 million for medium and $79.28 million for large can be reinvested in new applications and the people who put AI to work. Cost parity after 28.7 and 8.8 months at the modeled cloud benchmark rates makes ownership a compelling option for sustained demand.
Control remains valuable throughout that lifecycle. The enterprise chooses which models to deploy, when to update them, and who can access sensitive prompts and business context. Selecting where workloads run and applying consistent access and data-handling policies supports sovereignty requirements. Customer-owned AI allows those decisions to follow the organization's priorities and governance.
The token economics make that control tangible. Using the supplied inference inputs, the large Full System produces DeepSeek-R1 output at $0.1377 per million tokens against the $5.40 API output reference, about 97.5% lower. The medium and large Full System rental-hour tipping points are 15.6 and 6.1 hours per day. Customers can use these thresholds to decide how much steady demand to serve on owned infrastructure.
Both reference configurations use air cooling, and Digital Realty supports liquid-cooling options for future requirements [2]. Lenovo AI Express offers validated configurations and services for eligible deployments [6]. Together, Lenovo and Digital Realty give enterprises a practical way to own sustained AI capacity and keep control of their data and models. Lenovo Hybrid AI Advantage extends that foundation through Lenovo partnerships and TruScale options for demand spikes.
Workload validation connects these financial thresholds to deployment decisions. Through a DRIL engagement, enterprises can evaluate representative Lenovo workloads alongside throughput, latency, power, cooling, and connectivity requirements [12–13]. Those measurements provide a basis for refining the TCO assumptions and allocating sustained demand to owned capacity, with cloud or partner resources serving variable requirements. Digital Realty supports both architecture validation and the colocation foundation for production private AI.
References
For more information, see these resources:
- [1] Wani, S. G., Ellison, D., and Upton, J. On-Premise vs Cloud: Generative AI Total Cost of Ownership (2026 Edition). Lenovo Press LP2368, July 24, 2026. Lenovo Press:
https://lenovopress.lenovo.com/lp2368-on-premise-vs-cloud-generative-ai-total-cost-of-ownership-2026-edition - [2] Digital Realty. High-Density Colocation. Accessed October 23, 2026. High-Density Colocation
- [3] Digital Realty. ServiceFabric® Interconnection Solutions. Accessed October 23, 2026. ServiceFabric®
- [4] MLCommons. MLPerf Inference Datacenter benchmarks and scenario rules. Accessed October 23, 2026. Benchmark methodology
- [5] Groq. OpenAI GPT-OSS 120B model documentation and pricing. Accessed October 23, 2026. Model and API pricing
- [6] Lenovo. Lenovo AI Express with NVIDIA Accelerates Path to Hybrid AI Factory in Weeks. September 30, 2026. Lenovo AI Express
- [7] Lenovo. Medium and large enterprise configuration BOMs. Quote exports dated October 14, 2026.
- [8] Digital Realty. Colocation proposal and agreed deployment and pricing inputs. October 2026.
- [9] OpenCode Data. DeepSeek-R1 model data and output-cost reference. Accessed October 23, 2026. DeepSeek-R1 API reference
- [10] Lenovo. Lenovo Hybrid AI Advantage Accelerates Enterprise AI Transformation with New Services, Solutions, and Platforms. June 23, 2025. Lenovo Hybrid AI Advantage
- [11] Lenovo. Lenovo Introduces New Services that Bring Flexible, Affordable and Manageable AI to Enterprises. September 12, 2024. TruScale GPU as a Service
- [12] Digital Realty. Digital Realty Launches Innovation Lab to Accelerate AI and Hybrid Cloud Implementation. September 10, 2025. Accessed November 6, 2026. DRIL launch and partner participation
- [13] Digital Realty. Digital Realty Innovation Lab São Paulo Expands AI Infrastructure Testing in Latin America. November 5, 2026, distributed press release. Accessed November 6, 2026. São Paulo launch, established locations, planned expansion, and cooling capabilities
- [14] Digital Realty. 20261027_Q3Q26 Earnings Sharp. Q3 2026 IX Quarterly Report metrics, October 2026. Internal report
- [15] AWS. Amazon EC2 G7e instances are now generally available. January 20, 2026. Accessed November 6, 2026. G7e purchasing options
- [16] AWS. Amazon EC2 P6-B300 instances with NVIDIA Blackwell Ultra GPUs are now available. November 18, 2025. Accessed November 6, 2026. P6-B300 purchasing options
Authors
Sachin Gopal Wani is a Staff Data Scientist at Lenovo, working on end-to-end Machine Learning (ML) applications for varying customers. He has published articles on the sizing guide and provides sizing information for customers. Sachin holds extensive experience in AI solutions including LLMs, and Computer Vision. He graduated from Rutgers University as a gold medalist specializing in ML and has secured the J.N. Tata Scholarship.
Trademarks
Lenovo and the Lenovo logo are trademarks or registered trademarks of Lenovo in the United States, other countries, or both. A current list of Lenovo trademarks is available on the Web at https://www.lenovo.com/us/en/legal/copytrade/.
The following terms are trademarks of Lenovo in the United States, other countries, or both:
Lenovo®
Lenovo Hybrid AI Advantage™
Lenovo TruScale®
ThinkSystem®
TruScale®
XClarity®
The following terms are trademarks of other companies:
AMD®, AMD EPYC®, and EPYC® are trademarks of Advanced Micro Devices, Inc.
Intel®, the Intel logo and Xeon® are trademarks of Intel Corporation or its subsidiaries.
NVIDIA® is a trademark of NVIDIA Corporation.
Other company, product, or service names may be trademarks or service marks of others.
Configure and Buy
Please select a locale
Full Change History
Course Detail
Employees Only Content
The content in this document with a is only visible to employees who are logged in. Logon using your Lenovo ITcode and password via Lenovo single-signon (SSO).
The author of the document has determined that this content is classified as Lenovo Internal and should not be normally be made available to people who are not employees or contractors. This includes partners, customers, and competitors. The reasons may vary and you should reach out to the authors of the document for clarification, if needed. Be cautious about sharing this content with others as it may contain sensitive information.
Any visitor to the Lenovo Press web site who is not logged on will not be able to see this employee-only content. This content is excluded from search engine indexes and will not appear in any search results.
For all users, including logged-in employees, this employee-only content does not appear in the PDF version of this document.
This functionality is cookie based. The web site will normally remember your login state between browser sessions, however, if you clear cookies at the end of a session or work in an Incognito/Private browser window, then you will need to log in each time.
If you have any questions about this feature of the Lenovo Press web, please email David Watts at dwatts@lenovo.com.


